Table of Contents
The True Strength Index, or TSI, is a technical analysis indicator used by traders for many years to help identify trends and predict price movements in the financial markets. This indicator uses moving averages to measure the strength of upward and downward price movements, which can be used to make trading decisions based on market conditions.
While many different technical indicators exist, the TSI is considered one of the most reliable and accurate tools for predicting price movements. It is often used with other indicators and charting techniques to provide a complete picture of market trends and potential trading opportunities.


Many online resources can help you learn more about the True Strength Index and how it can be used in your trading strategies. With careful research and practice, you, too, can gain valuable insights into market trends using this powerful tool!


What is the TSI indicator?
The TSI, or True Strength Index indicator, is a technical momentum oscillator that is beneficial for determining oversold and overbought trade conditions. It acts as a momentum oscillator, notifying you about potential trend direction movements.
These trend direction changes can happen via signal line crossovers or centerline crossovers. TSI provides a strong warning when there are chances of trend weaknesses through divergence.
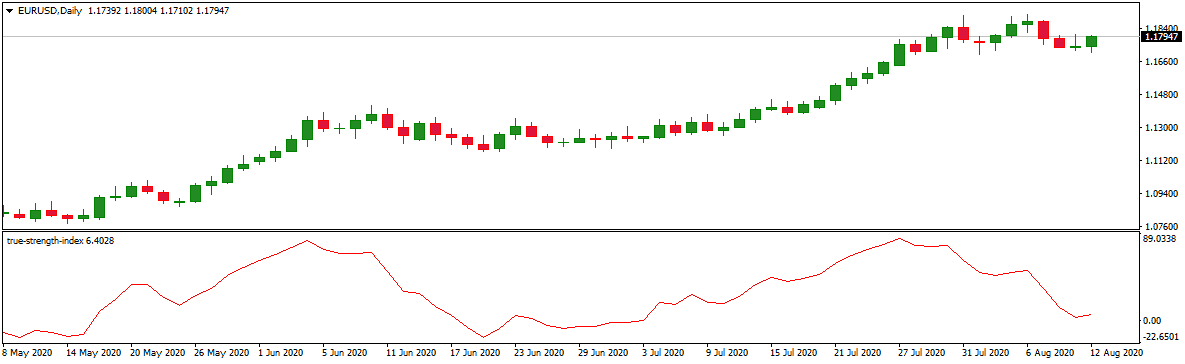
Download the True Strength Index TSI indicator.
Below this text download indicator in zip format:
True strength index tsi indicator download

How does the True Strength Index work?
In the previous sections, you learned about a quick overview of TSI. Let’s now understand how it works. This indicator is mainly used to identify overbought and oversold trade conditions. These conditions can happen when there is a change in available asset prices, trend direction, and spot divergence via the centerline crossovers. TSI will alert you about possible overbought and oversold conditions in these situations.
The True Strength, Index TSI indicator, will help you highlight and detect short-term price momentum conditions via signal line crossovers. Thus, you can clearly understand that the TSI indicator is mainly based on price movements. Due to this, its detection process for identifying oversold and overbought trade levels varies considerably based on your trading asset. For instance, different assets have different types of reversal rates. Some stocks may offer +30 and -30 price reversal rates. At the same time, some stocks may offer a price reversal rate between +20 and -20.
If you can carefully follow these price reversal changes and identify extreme TSI levels, you can easily and quickly spot overbought and oversold trade situations. If oversold trade situations exist, it does not necessarily mean it’s the ideal buying time. Similarly, an overbought trade situation doesn’t ultimately mean it’s the right time to sell. Instead, these situations help traders to analyze the market moves and make trade decisions accordingly. The traders typically watch for other signals before triggering a trade decision.
Sometimes, traders check for the price or TSI parameter to drop their values before selling an overbought asset condition. Some traders even wait for the signal line crossovers before making trade decisions. Let’s now talk about the signal line crossovers and centerline crossovers.
TSI Signal line crossovers
The accurate Strength Index indicator typically has a signal line. The crossover situation happens when the TSI line passes through the signal line. There can be two scenarios in this case.
For example, if the TSI line passes through the signal line from the above, this indicates the situation of short selling or warrant selling. On the contrary, if the TSI line passes through the signal line below, this implies an extended position.
Kindly note that signal line crossovers are pretty frequent. Hence, please use it with the original TSI and other available signals. For your reference, buy signal cases happen when the TSI line is above the centerline/zero position. Similarly, the sell signal cases occur when the TSI line is overbought territory.
TSI Centerline crossovers
Besides the signal line crossovers, TSI generates one more crossover known as the centerline crossover. This centerline crossover will also help you determine when the price momentum indicates a positive or negative sign. When the indicator lies above zero, the price momentum shows positive. Similarly, the price momentum becomes negative when the indicator lies below zero. Many traders use this centerline crossover to identify a directional bias situation.
For example, traders like you may consider a long position situation when the TSI indicator value is just above the centerline. Likewise, a trader may consider a short position when the indicator remains below zero/centerline.
TSI Breakouts and divergence
The accurate Strength Index TSI indicator can help traders identify price momentum shifts and breakouts. For example, when the TSI indicator lies below a trendline, continued selling is possible.
The TSI index provides information, including resistance levels and divergence. Divergence is indeed an effective and efficient tool for traders. This TSI or True Strength Index can help determine bearish and bullish divergence scenarios.
For example, when the asset price increases and the TSI index drops its value, this situation will be a bearish divergence. In bearish divergence, you will observe downside price movements. Similarly, when the TSI index rises, its value and price fall, leading to bullish divergence.
Please note that divergence and other signal parameters generated by the TSI value index or other technical indicators should be used.
TSI vs. MACD
These two indicators may have the same trading purpose, but their calculation procedure differs. TSI price changes from a technical oscillator. However, the MACD indicator measures the separation between two available moving averages.
To calculate the TSI, traders look at several factors, including price movements over time, the volume of trading activity, and volatility. By analyzing these factors, traders can get a more accurate picture of the overall market strength or weakness for any given stock or asset.
TSI = (PCDS/APCDS) x 100
Here, PCDS is denoted as a 13-period EMA value of PCS (EMA is exponential price average, and PCS is price change smoothened value). APCDS is designated as the 13-period EMA value of APCS (APCS is an absolute price change smoothened value)
To calculate the TSI index and its value, you must determine price changes and absolute price changes. Next, you will calculate the EMA values for both of these values. You should now find the 25-period EMA for the price change value and the 25-period EMA for the absolute price change value.
You can further smooth these two values by finding PCDS and APCDS. Once you know these two values, you can easily calculate TSI.
Conclusion
The accurate strength index (TSI) is a technical indicator that measures the magnitude of recent price changes to predict future price trends. Traders and analysts widely use this indicator to identify trend reversals, strength, and volatility. Despite its proven effectiveness, some limitations associated with the TSI must be considered when using it.
For example, the TSI relies heavily on past price movements, which may not accurately reflect future market conditions. Additionally, this indicator can be confusing since several different ways of calculating it exist. While the accurate strength index is imperfect, it is a valuable tool that can help improve trading performance when used appropriately.

He is an expert in financial niche, long-term trading, and weekly technical levels.
The primary field of Igor's research is the application of machine learning in algorithmic trading.
Education: Computer Engineering and Ph.D. in machine learning.
Igor regularly publishes trading-related videos on the Fxigor Youtube channel.
To contact Igor write on:
igor@forex.in.rs
