Table of Contents
An oscillator indicator in forex is a type of technical analysis tool used to measure momentum and potential price movements in the market. These indicators work by analyzing price data over a period and identifying patterns or trends that might indicate future price movements.
Traders typically use oscillators as part of their overall trading strategy, as they can help identify different entry and exit points for trades. Some common oscillator indicators include the RSI, MACD, and Stochastic Indicators. Each tool works slightly differently, but all are designed to help traders stay on top of market trends and make more informed trading decisions.


Suppose you are interested in learning more about oscillator indicators and how they can be used in your forex trading strategy. In that case, many online resources can provide detailed information on various indicators and systems. Additionally, many forex brokers offer educational resources such as training courses or webinars to help new traders learn more about using oscillators in their trading practices.


Stochastic oscillators and Relative Strength Index (RSI) are momentum oscillators. As much as both are the same kind, they have their strengths and weaknesses. It all comes down to which trading pattern you decide to use. One of these oscillators can be a tremendous investing signal.
For markets whose movements and changes are not easy to tell and unpredictable, stochastic becomes useful by forecasting the points just before the stocks alter, which helps decide when to buy or sell specific stocks. On the other hand, the RSI becomes handy and determines, in general, which stocks are trending.
Are Stochastic and RSI Indicators Similar?
Stochastic and RSI are price momentum oscillators primarily used to forecast trends in the stock market before they occur using past stock performance. Still, they have different functions in trading analysis.
Both RSI and Stochastic indicators cannot use to predict future prices because these indicators only present past performance without any machine learning predictive model. Using these indicators, traders try to find the best price levels to enter into trade.

In the stock market, if a trader can read a signal accurately and buys the stock before the market starts to trade, there is a massive chance of getting a lot of profit with very little capital.
In stock charts, Stochastic and RSI indicators are gauged on a scale of 0 to 100. Stochastic indicators were developed and improved from a probability concept known as the stochastic process. This process discovers mathematical probabilities using the progress and growth of a set of numerical variables. Also, unlike traditional stochastic mathematics, these variables are not chosen or generated randomly.
RSI can also be used to forecast movements in the stock exchange, especially in sudden trending stocks. RSI makes this possible by using past stock data and monitoring the immensity of price changes when stock will either go extraordinarily high or low. So, in general, stochastic and RSI indicators monitor and forecast the stock in the market. Still, they do it differently and with varying data collection and interpretation measures. Some analysts and traders prefer using the RSI, but both are excellent indicators.
Stochastic Oscillator
The Stochastic Oscillator is a popular trading indicator used by traders to help identify overbought and oversold market conditions. This indicator is based on the theory that when prices rise, they will continue to grow until a point of resistance is reached, at which point they will begin to fall. Similarly, when prices are falling, they will continue to fall until the end of support is gone, and they begin to rise again.
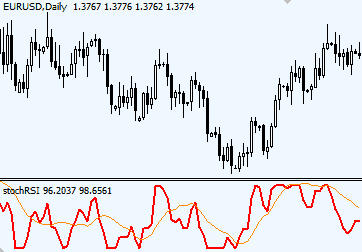
The Stochastic Oscillator uses these patterns in price movements to help predict future price action. The indicator plots two lines on a graph – one line representing the current price movement and another representing the average movement over a set period. When the lines cross one another, this is typically seen as an indication that the trend may change in favor of the opposite direction.
Because this indicator relies on past price movements to predict future ones, it can sometimes be difficult for traders to use it in their trading strategies effectively. However, with careful analysis and practice, many traders have successfully used the Stochastic Oscillator as part of their forex trading strategies.
Stochastic indicators are mainly used in markets where changes and movements in the forex and stock prices are within a specific range. These stocks are challenging and harder to make money from as the price fluctuation is within a particular range compared to other stocks with fluctuating prices in a much more comprehensive range. Stochastic lets the trader know when a stock is most likely at its highest and lowest price allowing the trader to see when a trade is favorable.
RSI Oscillator
The relative strength index, or RSI, is a popular indicator used by traders to measure the speed and change of price movements in an asset. RSI is an oscillator, meaning its values fluctuate between 0 and 100, with the former representing oversold conditions and the latter representing overbought conditions.
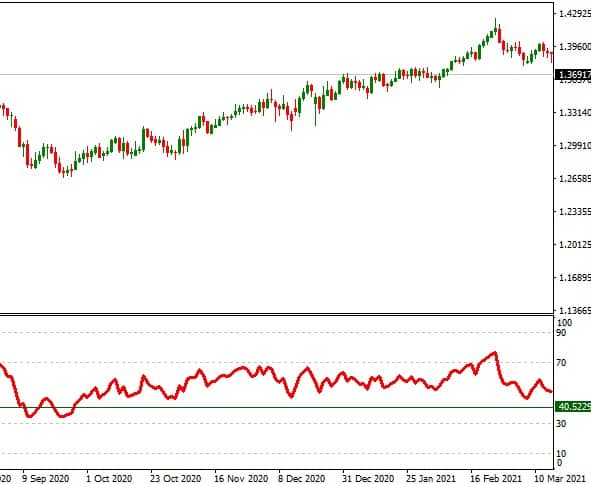
RSI can help determine whether an asset’s price is “overbought” or “oversold,” meaning that it has risen too fast and may be due for a downward correction. When RSI rises above 70, it generally indicates that the asset’s price has risen too quickly and is likely due to a pullback. Similarly, when RSI falls below 30, it typically means that the price has fallen too rapidly and could be due for a rally.
RSI can also identify potential entry points into an asset’s price movement. For example, if RSI rises above 70 but pulls back from this level before making another upward push, it may signal a buying opportunity as the upward momentum outweighs overbought conditions. Likewise, if RSI falls below 30 but then recovers above this level before resuming its downward trend, it may indicate a selling opportunity as prices become undervalued again.
Overall, RSI is a valuable tool to help traders identify overbought and oversold conditions in an asset’s price movement. By combining this indicator with other technical analysis tools, such as support and resistance levels or moving averages, traders can build more robust trading strategies that help them capitalize on both uptrends and downtrends in the markets.
Stochastic Oscillator vs. Relative Strength Index (RSI)
- Stochastic uses the thinking that prices have a close tendency to end near their highs during uptrends, but RSI works on the thought that prices can most likely move far from a difficult position before giving a reaction.
- Stochastic uses recent closing prices and highs and lows of stock to calculate values, while RSI detects trend strength.
- Although the indicators aim to identify overbought or oversold stocks, the two indicators give different results. The RSI aids traders in figuring out when a stock price rises or drops too fast, but the stochastic aids traders know when a stock price moves to the highest or lowest point in the trading range.
- RSI performs effectively in trending stock markets. Stochastic gives good results and performs well in slow-moving or non-trending markets.
- Regarding performance, the RSI can be faster in computing and move quickly between stocks and prices during analysis; meanwhile, the stochastic can be slower.
- The RSI was designed to measure momentum and strength of assets at the same time.
While both indicators use different approaches to calculate the value and determine future stock movements, they have some key differences.
Another critical difference between these two indicators is their effectiveness in different market conditions. The RSI tends to perform well in trending markets, while the stochastic can be more useful in range-bound or choppy markets where prices often move far from the previous high or low point.
Overall, both the stochastic oscillator and the relative strength index offer valuable insights for traders looking to identify overbought or oversold stocks. However, it is essential to understand their strengths and weaknesses to use these indicators in your trading strategy effectively.
RSI advantages over Stochastic indicator
When aiming to get the best trading results, it can be crucial to know the best time to use the different price momentum oscillators. A trader should be adaptable and know when to switch because any oscillator can be misleading if misused. Both indicators can be used depending on the general market trend and stock behavior.
Below can be instances where it is better to use RSI over Stochastic.
- Security adjustments: If a trader has a stock that is not moving from 70 and has been considered overbought at 60, the RSI displays that it is a security stock, and the trend for the stock can be turned upwards. This indicates solid trends, stability, and staying power stocks.
- Analyzing chart patterns: RSI indicators check previous stock performances, and this helps control or dictate chart patterns for stocks, such as trend lines, bottoms, and double tops. RSI also indicates resistance or support for a stock’s recent trend.
- Price reversal: RSI can also tell if an upcoming price reversal on stock will occur by displaying how stock prices can turn away from RSI trends.
When To Use Stochastic Indicators?
If one’s trading system is trading on a stock with small increases that stays within a specified range, then stochastic indicators will be a handy tool. Stochastic indicators can forecast exact and slight changes in a stock’s price.
Instances where it is better to use stochastic include:
- Moving averages: Using a stochastic indicator is a perfect way to ascertain how a stock will act before it starts moving. This can be important in sideways stock markets where price changes can be irregular.
- Long-term and short-term investing: With stochastic indicators being excellent in short-term price changes, one can also learn about trends in long-term stock investments.
- Consistent Ranges: Stochastic indicators are efficient in scenarios where stock prices fall in a constant range. This situation allows the indicators to determine the slightest trend in a stock’s movements.
Stochastic indicators are more exact than RSI indicators but can give a trader a clear picture of a stock’s future trends.
Does Keeping Track of Price Momentum Oscillators Work?
Yes, keeping track of price momentum oscillators does work. Price momentum oscillators like RSI and stochastic are instrumental in helping traders understand stock market trends.
Some statistical experiments have shown that value stocks tend to do better in the market, and while small-cap stocks come with considerable risk, they can also give good rewards.
RSI can be a fantastic choice for analyzing stock trends to ascertain which stocks are good enough to trade with and give valuable returns.
Stochastic also gives day traders a chance to move swiftly to take advantage of small shifts in the stock market.
Conclusion
I prefer to use RSI because this indicator combines strong trend valuation and trend direction. Based on the comparison of the Stochastic Oscillator and Relative Strength Index, it seems clear that these two indicators have some key differences in their approach and performance. While Stochastic uses recent prices and highs/lows to calculate its values, RSI considers a wide range of information from past stock performances. This makes RSI better suited to identify overbought or oversold conditions in trending markets. In contrast, Stochastic is better suited to recognizing when stock/forex prices reach extreme points within the trading range. Ultimately, both indicators are useful tools for traders looking to identify potential opportunities in the market, and it is important to consider their strengths and weaknesses when making trading decisions.

He is an expert in financial niche, long-term trading, and weekly technical levels.
The primary field of Igor's research is the application of machine learning in algorithmic trading.
Education: Computer Engineering and Ph.D. in machine learning.
Igor regularly publishes trading-related videos on the Fxigor Youtube channel.
To contact Igor write on:
igor@forex.in.rs
Related posts:
- How to Use Stochastic Oscillator? – Stochastic Oscillator in Technical Analysis
- How Does the Relative Strength Index work ?
- How Does Stochastic RSI Work? – Stochastic RSI Calculation
- Twiggs Momentum Oscillator Formula
- Free Download True Strength Index TSI Indicator
- Download RMI Indicator – Relative Momentum Index Formula
- Awesome Oscillator Formula
- Is RSI Leading or Lagging Indicator? – Everything About Relative Strength Index Indicator
- Awesome Oscillator and MACD Strategy! – Awesome Oscillator vs. MACD
- Download Woodies CCI Arrow Oscillator Indicator
- What is Commodity Channel Index Indicator?
- What is The Money Flow Index MFI indicator?
