Table of Contents
The DMI or Directional Movement Index indicator is a tool that helps traders to define a trend in the market efficiently. This tool was first introduced to the world by Wells Wilder in 1978. This tool holds some eccentric properties, like bringing the results via the assessment of high and low prices and not the closing bar prices.
DMI follows the area of the last bar that is connected with the candlestick pattern. Hence, if the low and high points of the last bar are more than the points on the previous bar, the protruding upward movement of the bar depicts a bullish movement in the market. On the other hand, if the values are less than the value of the previous bar, the downward protruding movement of the extreme candlestick in comparison with the second last candlestick signals a bearish price direction.


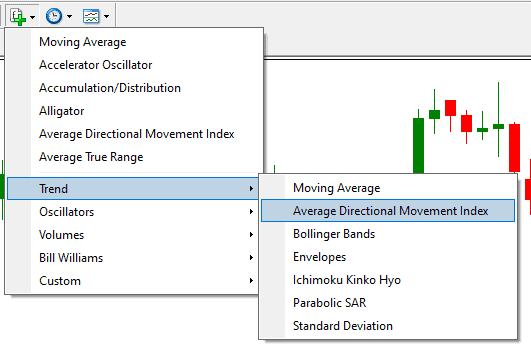
Average Directional Movement Index Indicator you can add on your chart using Metatrader by default if you go to trend section and choose “Average Directional Movement Index Indicator”:


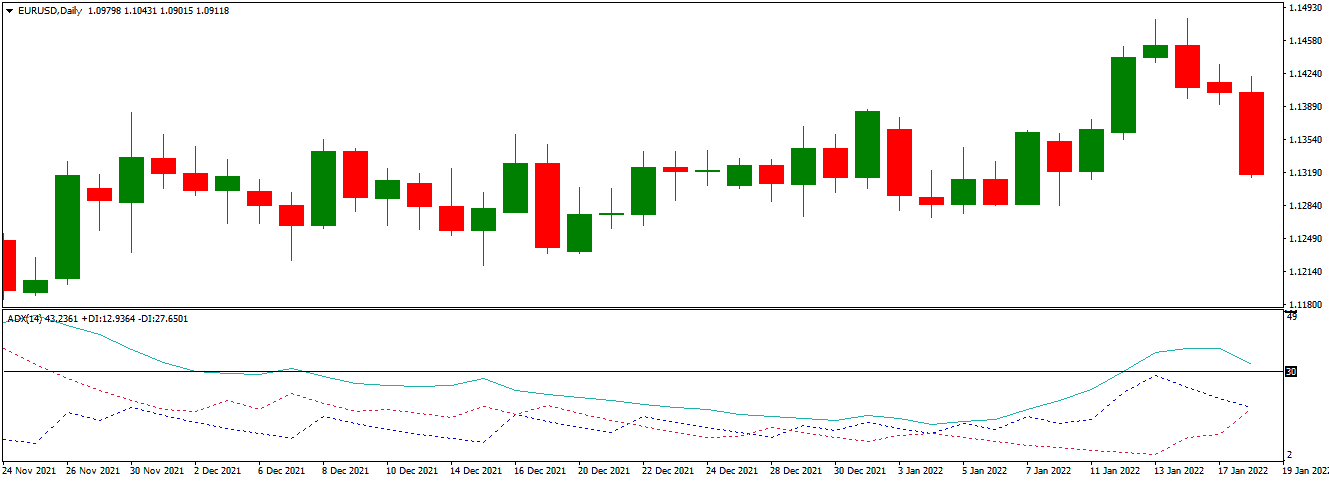
The working process of Directional Movement Indicator
Even a beginner trader can interpret the results of this indicator with fluency because of the visual depiction of movement and direction. This indicator has 3 colors that are symbolic of different stages in the market. The green color indicates a bullish market, the gray color depicts the consolidation, and the orange color is the indication of a bearish trend.
You can also see the noise in the indicator, which is subjective for an instrument that you monitor with the help of the DMI indicator. Hence, you should experiment with DMI and signal periods and you should alternate the timeframes to reduce noise.

DMI trading strategies
Buy strategy
- Be patient for the green color to appear on the indicator.
- Continue to define if the indicator level is above zero.
- Wait for the closing of the bullish candlestick.
- Assume the long trade position with stop loss near the swing low position. Now, you need to place the profit point on the following resistance level.
Sell strategy
- Be patient for the green color to appear on the indicator.
- Continue to define if the indicator level is above zero.
- Wait for the closing of the bullish candlestick.
- Assume the long trade position with stop loss near the swing low position. Now, you need to place the profit point on the following resistance level.
Conclusion
This indicator is essential for technical traders if they want to gain profits in the market. However, you cannot use this tool solely. To eliminate any risks, it is better to use it in combination with other indicators and verify your entries.

He is an expert in financial niche, long-term trading, and weekly technical levels.
The primary field of Igor's research is the application of machine learning in algorithmic trading.
Education: Computer Engineering and Ph.D. in machine learning.
Igor regularly publishes trading-related videos on the Fxigor Youtube channel.
To contact Igor write on:
igor@forex.in.rs
Related posts:
- Directional Movement System
- Choppiness Index Indicator For MT4 Download Free!
- Traders Dynamic Index Indicator – Download TDI Indicator
- What is Commodity Channel Index Indicator?
- Moving Average High Low Indicator- Download Moving Average Channel Indicator MT4!
- Download ADX Histogram Indicator
- Is RSI Leading or Lagging Indicator? – Everything About Relative Strength Index Indicator
- Volume Weighted Moving Average Indicator
- Free Download True Strength Index TSI Indicator
- Download Free Hawkeye Volume MT4 Indicator! – How to read Hawkeye volume indicator?
- Forex Chart Pattern Indicator Free Download
- MBFX Timing Indicator – Free download MT4 Indicator
