Table of Contents
The stochastic RSI indicator is one of the most widely used technical analysis tools for assessing market trends and predicting future price movement. This oscillator uses an RSI calculation, but instead of using price data to generate a signal, it uses the closing prices of the underlying asset. The two lines in stochastic RSI represent different aspects of this calculation.
In’ The New Technical Trader, Stanley Kroll and Tushar Chande described a momentum oscillator, Stochastic RSI.’ This book talks about how every tick affects the market. You can use it to check if your chosen technical indicators are well-suited for your trading strategy. Stochastic RSI is a momentum oscillator, meaning it measures the change in the price of a security over a while. Stochastic RSI also generates overbought and oversold market signals, but it does it more efficiently than its contemporary, Relative Strength Index.


How does Stochastic RSI work?
Stochastic RSI represents the oscillator indicator that uses the Stochastic formula to set Relative strength index (RSI) values instead of standard close price data. The stochastic indicator works as an oscillator that increases the regular RSI indicator’s sensitivity and reliability when trading off overbought and oversold RSI price levels.


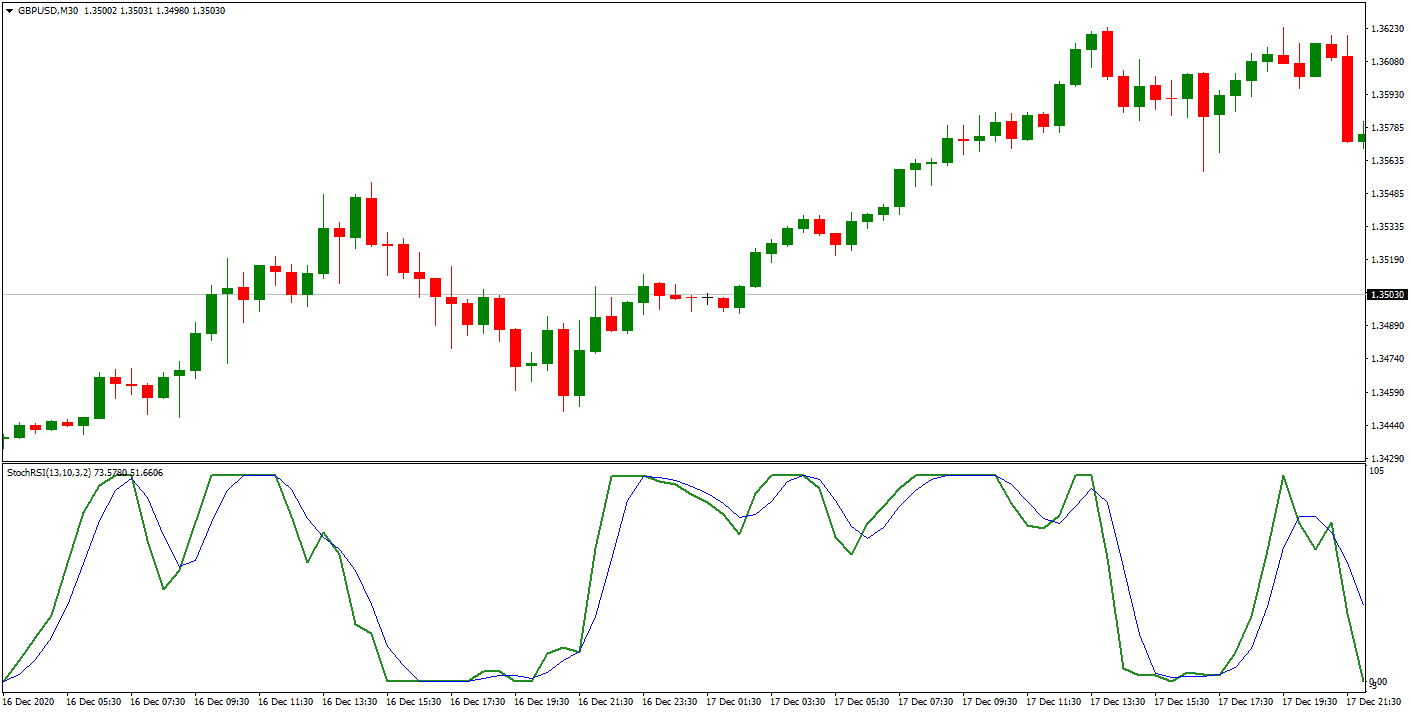
When we look chart, we can ask this question:
What are the two lines in stochastic RSI?
Two lines in stochastic RSI are the fast line, called “%K.” and the slower line, called “%D,” representing a moving average of %K. Both lines are calculated using the stochastic formula applied to the closing price of RSI.
The first line is referred to as “%K.” It is a fast line that usually moves rapidly, especially during volatile times. It reflects recent price action, allowing traders to identify potential buy and sell signals more quickly than traditional indicators. %K is calculated by dividing the current period’s closing price by its highest and lowest low over a defined look-back period.
The second line is known as “%D” which is a slower-moving average of %K. This line helps filter out some of the noise in %K, making it easier for traders to identify actual turning points in market direction. %D also gives traders an indication of trend strength or momentum and can help determine when a new trend may start or end. The calculation for %D involves taking a three-day moving average of %K to smooth out some oscillations and provide a better picture of market direction.

Both lines in stochastic RSI are essential components for analyzing asset prices and forecasting future movements. By combining these two readings, traders can gain valuable insight into market conditions that would otherwise be difficult to obtain without additional analysis or time-consuming observation. When used correctly, this strategy can increase accuracy when predicting future price movements and improve profits on individual trades by reducing risk exposure while allowing for an aggressive approach when appropriate market conditions exist.
Stochastic RSI MT4 Download
Please download the stochastic RSI indicator for free.
Stochastic RSI vs. RSI
Difference between Stochastic RSI and RSI
The difference between stochastic RSI and RSI is that the RSI oscillator measures the speed and change of price movements using the closing price of a security to a range of its prices over a certain period. On another side, the stochastic RSI measures the RSI momentum based on RSI’s closing price.
The Relative Strength Index (RSI) is an important indicator used in technical analysis to measure the speed and change of price movements. It uses a variation of the price relative to a range of prices seen in the past. The stochastic RSI is a momentum oscillator that measures the RSI’s closing price over time. This article will explain the differences between these two indicators and how they can be used to identify trend reversals and gauge market sentiment.
The RSI oscillator measures the speed and change of price movements by plotting points above and below a centerline of 50% over a specific period. It uses values between 0 and 100: anything above 70 is considered overbought, while anything below 30 is considered oversold. When the RSI line crosses above 70 or below 30, it indicates that there could be a potential trend reversal coming soon.
The stochastic RSI, on the other hand, takes into account both the momentum and direction of an asset’s price relative to its range over a specified period. The indicator plots values between 0-100, with readings above 80 indicating an overbought condition while readings below 20 indicate an oversold situation. When this indicator crosses above 80 or below 20, it signals that there could be a potential trend reversal coming soon as well.
In addition to using these two indicators as part of their trading strategies, traders may use them together as confirmation signals when identifying turning points in markets or making entry/exit decisions on trades. For example, when both indicators show signs that prices are starting to move away from being extraordinarily overbought or sold, it can confirm that there could be potential for further upside or downside action shortly.
There are also some differences between these two indicators when interpreting their signals effectively. While RSI often gives traders early indications of potential trend reversals, stochastic RSI is more focused on determining when those reversals occur so they can make informed decisions about entries/exits at optimal levels (when prices are most likely to move). As such, traders should consider both indicators in their trading decisions before entering into any position to ensure they have all available information when making their trades.
Trading with RSI and stochastic indicators
According to Kroll and Chande, the ideal setting for overbought/oversold signals is 80/20. This is different than the usual 70/30 setting of an average RSI.
Understanding trading signals:
- As the Stochastic RSI falls and comes down below the oversold level before recovering, it’s time to go long.
- As the Stochastic RSI rises and crosses over the oversold level before falling, it’s time to go short.
Using this momentum oscillator with a trend filter is better for confirming the trend’s direction. You can follow it and plan your exit when the signal is opposite rather than the reverse.
Following the Trend using Stochastic RSI
This momentum oscillator still has the same problem as its counterparts; it can push the traders out of the trade too early, especially when the trend is weak. Therefore this oscillator should not be used alone. You must use it with trend filters to ensure that the signal’s strength doesn’t push you out prematurely. You can use Stochastic RSI with the Moving Averages or other non-momentum oscillators like the accumulation distribution line.
Stochastic RSI Calculation – stochastic RSI formula
The stochastic RSI formula is:
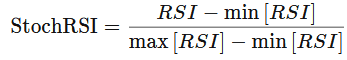
where
X is a period of usually 14
RSI = Current RSI reading;
Lowest RSI = Lowest RSI in last X periods
Highest RSI = Highest RSI reading in the previous X period
This is how you can the Stochastic RSI value:
- First, you need to calculate the RSI or the Relative Strength Index for a chosen period of a data series.
- Once you have your RSI value, subtract the minimum value for the chosen period from the latest RSI value.
- Again, subtract the minimum value for the chosen period from the highest RSI value. Keep in mind that the period should be the same.
- No, divide the result you got from point number 2 by the result you got from point number 3. This will give you the Stochastic RSI value.
Stochastic RSI trading strategy
Usually, the stochastic RSI indicator strategy is based on the idea to BUY when the primary trend is bullish and stochastic lines cross in the oversold area and SELL when the primary trend is bearish and stochastic lines cross in the overbought area.
This indicator can be used to buy or sell a security when it is in pullback mode after correction.
Stochastic RSI trading strategy example:
BUY if the price is above SMA 100 on the H1 chart AND stochastic RSI lines K and D are crossed in the oversold area.
Sell if the price is below SMA 100 on the H1 chart AND stochastic RSI lines K and D are crossed in the overbought area.
Conclusion
Overall, understanding and recognizing the differences between RSI and RSI stochastic indicator indicators can help traders become more informed about potential market changes so they can make better trading decisions based on current conditions seen in markets at any given point in time. By being aware of these essential distinctions when constructing their strategies, traders can maximize their chances for success when participating in any financial market activity.
I think RSI Stochastic is very similar to RSI, so that you can choose any of these indicators.

He is an expert in financial niche, long-term trading, and weekly technical levels.
The primary field of Igor's research is the application of machine learning in algorithmic trading.
Education: Computer Engineering and Ph.D. in machine learning.
Igor regularly publishes trading-related videos on the Fxigor Youtube channel.
To contact Igor write on:
igor@forex.in.rs
