Table of Contents
Many technical analysis tools are available for Forex traders using the MT4 platform. One such valuable tool is the Pivot Point Indicator. As the name suggests, this indicator helps traders plot the points of possible trend reversals in the Forex chart.
Download Pivot Point Indicator MT4
Below, you can download two Pivot point indicators for MT4 with several Pivot point method calculations such as Classic, Woodie, Camarilla, etc.


DOWNLOAD PIVOT POINT INDICATOR


Additionally, you can try to download this indicator too:
This is an all-in-one indicator because it sometimes acts as a support or resistance apart from indicating a trend reversal. As we all know, MT4 does not have any in-built indicator by default; it gives the trader the privilege to use the tools at their convenience. So, the trader can download the Pivot Point Indicator and start using it on the MT4 platform.

Read this article to understand more about the Pivot Point Indicator, how it can be used while trading Forex, and how helpful it can be to Forex traders.
How Does the Pivot Point Indicator Works on MT4?
The Pivot Point Indicator is an easy-to-use technical analysis tool. A trader can apply it to the Forex chart on MT4, and it will automatically calculate and plot all interactive levels. Based on the plotted levels, traders can easily understand possible price movements and trend reversals.
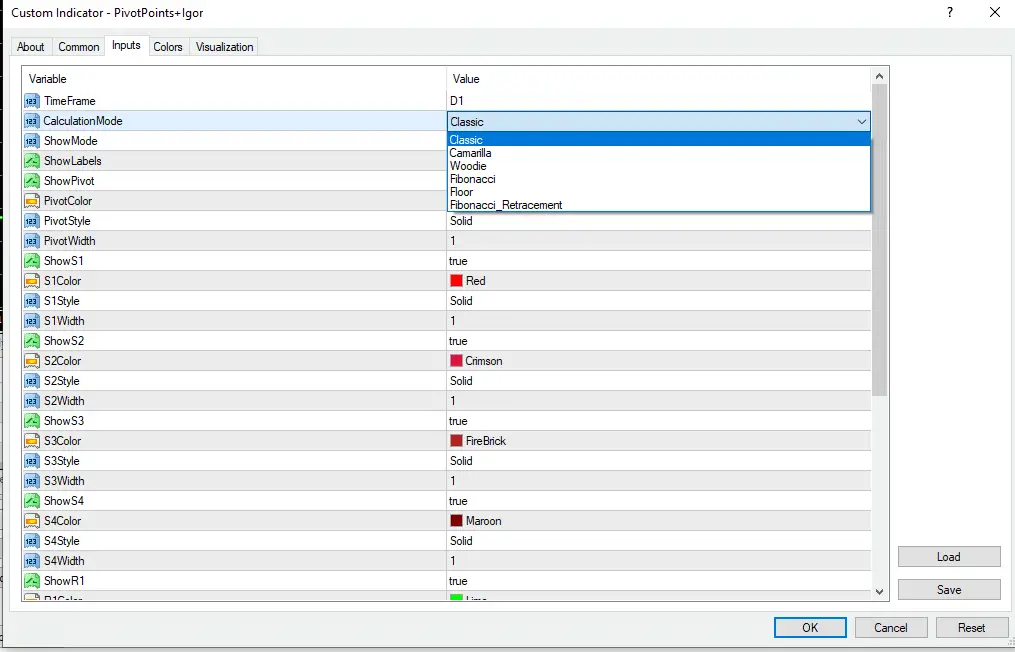
A feature that differentiates it from other indicators is that it combines all other methods to indicate reversal levels. These methods are CPR, Woodie, Camarilla, Classical, and Fibonacci. This indicator may use different methods for plotting the pivot points on the Forex chart, but how they are marked is similar. Since the formula for using each method is different, the pivot points plotted on the MT4 chart may differ slightly in each case.
Therefore, it becomes essential to understand how each method is used and applied and which method is best suitable for your trading style and plan.
Different Methods to Calculate Pivot Points on MT4
The following is the list of all the methods used to plot pivot points and how these methods are used.
Many Forex traders favor this method due to its straightforward approach and simplicity. This method uses three variables: the closing price, the low point, and the high end of the initial trading session. As it is the most uncomplicated method, many traders prefer this classical method over other available options.
- Camarilla Method
This method is highly preferred by Forex traders interested in scalping or intraday trading. This is mainly because this method provides accurate support and resistance levels.
- CPR
The Central Pivot Range, or CPR, differs from other methods in the same category. However, all types of traders can use this method as it helps to determine the upcoming trend in the market.
CPR uses a three-line method. These lines include the main pivot line and two other lines; each placed overhead and below this principal pivot line. If the price in the forex chart stays above these three lines, a possible uptrend is approaching. Conversely, if the price level remains lower than these three lines, then the uptrend is getting weaker, and a downward trend is approaching.
- Fibonacci Method
The Fibonacci method of drawing pivot points is similar to the original Fibonacci theory. However, this method recognizes the resumption points after correcting the global trend. Therefore, it is suitable for those who wish to trade in the primary ongoing trend. Also, this method can help forex traders make profitable returns by helping them understand the entry and exit points more clearly.
Evidently, if traders recognize the trend reversal well in advance, it can help them take an open position at a good time. It doesn’t matter if they hold the open position for a long or shorter period; the key is to hold it at the correct time. This method of plotting pivot points is more focused on the closing price of the initial session and, therefore, gives the maximum probability of the trend reversal.
Pivot Point Calculator
Please use the current Pivot Points calculator to calculate current market Pivot Points:
How to Interpret and Use Pivot Points in Trading?
Put simply, pivot points indicate the support and resistance levels. These levels indicate the turn-up of a substantial price event. The reason is that the price is not likely to fall below the support level or go beyond the resistance level. Thus, the trading trend would reverse at these points.
Objectives of the Pivot Point Indicator
The following are the objectives that the Pivot Point Indicator helps forex traders to achieve:
- The main objective of this indicator is to identify the pivot points, that is, possible trend reversal levels.
- This indicator helps the trader understand the possible upcoming trends and plan their entry and exit through the market.
- It also helps the trader recognize the take-profit and stop-loss in the current trend.
How To Discover Trend Resumption Points Using Pivot Point Indicator
It is essential to plot the correction level in the current trend to discover the trend resumption points. And this can be done when traders use the Fibonacci method of plotting pivot points.
When you apply the Fibonacci method to your MT4 chart, you can trace the level at which the correction replaces the current trend. So, for example, if the market has a downward trend, it slows down at the time of correction. This can easily be sighted where there is a pile-up of price movements in one spot or by long candlesticks.
However, it is suggested to confirm the price movement after it starts trending after the correction. If there is an uptrend, this can be done by buying. It is also advised not to apply a stop loss when practicing the new trend.
How To Identify Take-Profit or Stop-Loss Levels Using the Pivot Point Indicator
As discussed above, the classical plotting of pivot points uses the three-line method. This method’s lower and upper lines can identify the take-profit or stop-loss levels.
For example, you take the high and low points from the initial session and plot them against the current trend. You observe that the price bounces back or retraces near the lower point. This means this point works as your support level, and you can put your stop-loss near this level.
Similarly, the trend retraces when it reaches a high point. So, again, this provides you with a hint of where to put your take-profit level.
However, this is just an example, and the situation is not always the same. Therefore, traders should ensure actual trend reversals at these high and low points before declaring their take-profit and stop-loss levels.
The base of the indicator
You can use the Daily Pivot Points Indicator for MT4 to find the levels where the reversal will occur. This indicator consists of thirteen horizontal lines. These levels indicate the possibility of support and resistance on specific points where the price movement tends to modify. For example, if there is a chart where R1, R2, and R3 levels are the 1st, 2nd, and 3rd resistance levels. The S1, S2, and S3 are the support levels. The yellow horizontal line is the pivot line between support and resistance levels.
This indicator also determines the potential midpoints and intermediate levels between the pivot point and support and resistance zones. The advantage of using the Daily Pivot Points Indicator for MT4 is that the technical traders will not struggle with placing support or resistance zones in the market.
Moreover, all traders use this indicator using the same calculation method. Day traders can leverage this tool to determine price movement and place profitable trades. Market makers and Forex experts also use this tool to find the prospective reversal point.
Usage of Daily Pivot Point Indicator for MT4
This tool works effectively for both range-bound traders and breakout traders. For range traders, this indicator finds the potential reversal levels to buy and sell in the market. Meanwhile, traders can use it to find the crucial zones that will break out before trading.
For example, the breakout of R1, R2, and R3 signals to the trader rising buying momentum and the prevalence of a bullish market. In such a situation, the buy order will be placed on the breaks of levels.
On the other hand, the breakout of S1, S2, and S3 signals rising selling momentum and a bearish market. You can sell at these levels. Additionally, this indicator helps determine the stop-loss and take-profit levels. You can use candlestick patterns to garner a good outcome.
Final thoughts
The Daily Pivot Points Indicator for MT4 is a big help in identifying reversal points and where to place these trades. You can use this indicator with MACD, RSI, and many more.
Conclusion
The Pivot Point Indicator is free to use while trading Forex through MT4. It has many uses and helps the trader get more than one piece of information using just one tool. In addition, it has many methods, and traders can choose any of them that follow their methods and trading style. However, using this indicator requires the trader to have some prior knowledge, so beginners may need to get upskilled before using this indicator.
Also, traders can use other indicators or technical trading tools to get concrete market analyses.

He is an expert in financial niche, long-term trading, and weekly technical levels.
The primary field of Igor's research is the application of machine learning in algorithmic trading.
Education: Computer Engineering and Ph.D. in machine learning.
Igor regularly publishes trading-related videos on the Fxigor Youtube channel.
To contact Igor write on:
igor@forex.in.rs
