Table of Contents
What are Pivot Point levels?
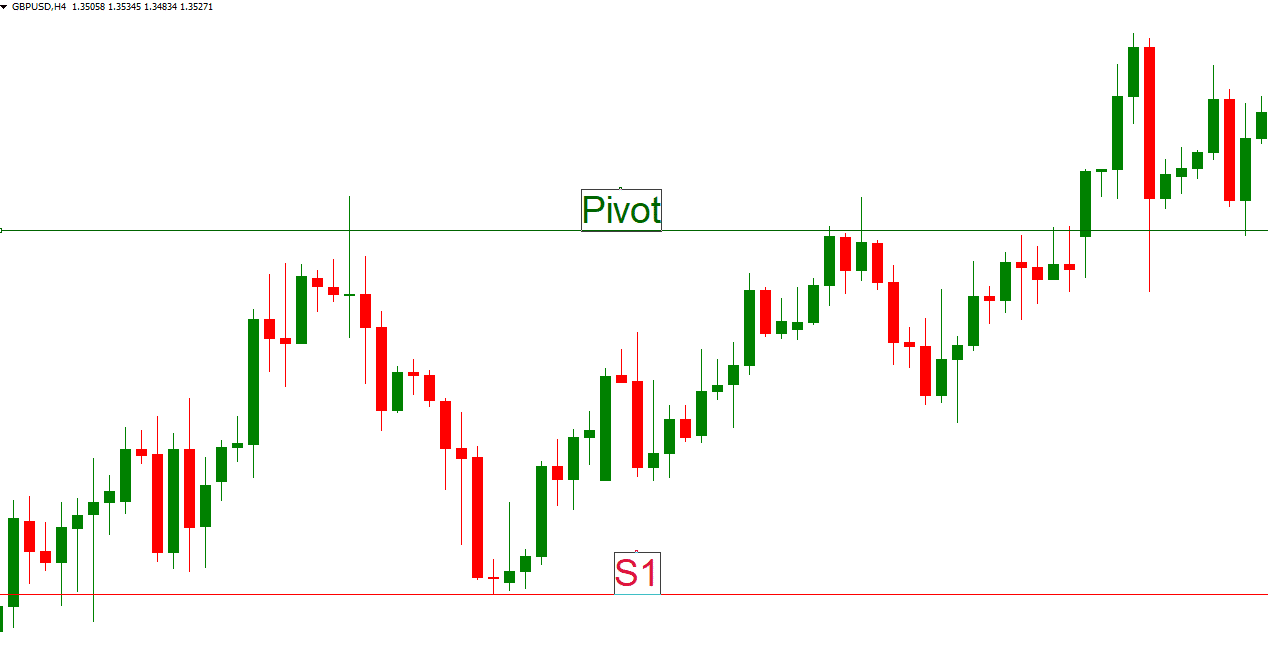
The pivot point levels are price levels on the trading chart calculated based on the previous trading sessions’ high, low, and closing rates. They help decide the support and the resistance level for the current and next trading sessions. Pivot point price levels can be used as support and resistance price levels and help traders decide when to enter the market and exit.


In this article, please find out how it can be possible to use a pivot point indicator for the toolbox for technical analysis to verify reversal or continuation indicators.


What Are The Woodie Pivot Points?
Woodie pivot points represent basic price levels that traders calculate based on the previous high, previous low price, and previous open price. Woodie’s pivot points approach gives more weight to the previous session’s close compared toit with the standard Pivot point strategy. Woodie pivot price level equals one-quarter of the high, low, and two open price level sum.
Woodie pivot point calculation formula
- Distance = High – Low
- Pivot Point (P) = (High + Low + (Period’s Open * 2)) / 4
- Support level 1 (S1) = (2 * P) – High
- Support level 2 (S2) = P – Distance
- Support level 3 (S3) = Low – 2 * (High – P)
- Support level 4 (S4) = S3 – Distance
- Resistance level 1 (R1) = (2 * P) – Low
- Resistance level 2 (R2) = P + Distance
- Resistance level 3 (R3) = High + 2 * (P – Low)
- Resistance level 4 (R4) = R3 + Distance
Over here,
- H represents the past day’s high price.
- L represents the past day’s low price.
- C represents the past day’s price of closing.
- PP is the pivot point.
- R3, R2, R1 are lines of resistance 3, 2, and 1.
- S3, S2, and S1 are support lines 3, 2, and 1.
As these lines get calculated and are further plotted right on a chart, resistance and support lines could be placed into the main context and be further interpreted.
When you mainly think of a point, it assists in thinking of it considering the price level at the baseline for that very day. The original price tends to fluctuate relatively with its baseline.

Prices are basically of these three from the day that went by:
- High of the previous day.
- Low of the previous day.
- The closing price of the previous day.
Woodie Pivot Point Calculator
Please, use the current Pivot Points calculator to calculate current market Pivot Points:
How to use Woodie’s pivot points?
Woodie’s pivot points you can use as price levels for entry, stop loss, or target position. In addition, Woodie’s pivot points approach gives more weight to the previous session’s close compared toit with the standard Pivot point strategy.
Once the price tends to go upwards from the point, it will begin to approach the level of resistance, wherein as the price tends to go down, it then moves to go towards support. So the point in itself can be either the line of resistance or support.
For your information, a line of support is meant to be indicating a level of price at which the pressure of buying can impact the prices, all depending on the past day’s history of trade. Just like that, the line of resistance is meant to be signifying the opposite, i.e., the pressure of selling.
Therefore, when the price trends are on the downside, one can take the point as a line of support. Contrastingly, if the price is trending on the upside, moving towards the point, it will be considered a resistance line.
Woodie pivot points are amongst different pivot points strategies:
- Camarilla Pivot Point
- Fibonacci Pivot Point
- Standard Pivot Point
What are Classical Camarilla and Woodie’s pivot points?
Classical Camarilla and Woodie’s pivot point represent basic price levels that traders calculate based on the previous high, low price, and close. Pivot point price levels and mark critical price levels as future support and resistance areas.
One thing that separates the pivot analysis is that the projected lines of resistance and support get calculated differently, considering the number of points there are present. Nevertheless, the Woodie Pivot Points are just like every else are put to use to indicate the following things:
- Reversal of the price trend.
- Continuation of the price trend.
The lines of support calculated by this same method are good to verify any indicators used for analyzing technically. Also, as the point gets calculated based on the last day’s trading data, it becomes an efficient tool for all traders into short-term options.
I was wondering how to determine pivot points? Before we understand the trading procedure, let’s know thind it!
How To Interpret Woodie Pivot Points?
Initially, you should be identifying the trend of the price, and the same could be done by just taking a look at the chart displaying the price, whereas the actual point would just be showing a bearish or bullish pattern. To identify the bearish or bullish pattern the point of a pivot is signifying, the volume could be put to use, especially when discussing the trustworthy output of Woodie Pivot Points.
Once you have understood and picked out the trend, the resistance and support lines lie within a particular context. Lines of resistance and support exist based on the recent trend and current price. But, what context? When calculated with the data attained from the past day, these lines are the exact context we’re talking about.
What are pivot point support and resistance levels?
Now, this is something we should discuss! It is straightforward; you have to read the indicators of the price trend continuation or reversal. If you do day trading using pivot points, the price of the very asset of your choice might fluctuate and go down and up. There will be bounces off the resistance and support lines in more precise terms. Just place:
- Buy when you observe a reversal at the line of support.
- Sell or shorten when you observe a reversal on the line of resistance.
Also, it is good to know that every resistance and support line may have its weight. As far as the line of support will be from the point, the market will be showing a more bearish nature. For resistance, it is the same but on different levels. That is:
- Level of Resistance 3: A market totally in a bullish situation.
- Level of Resistance 2: Market in a typical bullish situation.
- Level of Resistance 1: Mild bullish transforming to a bearish situation.
Every line of resistance and support is an intensity indicator of the pressure of buying or selling at the provided price. The more the pressure is, the chances for the price bouncing off the line gets higher.
Are Woodie Pivot Points reliable?
Woodie Pivot Points price levels usually match significant price levels like other pivot points formulas. However, Woodie critical price levels you should use with a combination with other technical and fundamental parameters.
Woodie Pivot point’s strategy is less reliable than the standard Pivot Point strategy. You can read more in the Pivot point research study.
How can you improve the reliability of the Woodie Pivot Points while trading?
When it comes to a line of resistance, it in itself isn’t a very tough barrier that could guarantee you that the rise in the price pauses or falls in a single second. But, just like that, the line of support in itself does not assure a fall in the price or a turnaround that would make a massive difference. So, to improve the dependability of Woodie Points, these should get used in relativity with the other indicators of technical analysis.
Reliability highly depends on the hands of the trading personnel as well. A trader must be trying and adding pivot points with the algorithm they’re using for analysis and put it to test along with the simulations. With this, you measure the accuracy of your current method as well. Here’s how you do it:
- Without Woodie pivot points vs. Woodie Pivots and lines of resistance and support.
- Other means of projecting the lines of support and resistance vs. Woodie Pivots.
A woodie point’s reliability increases when the following fit in your present trading method after being calibrated and tested.
How to use a pivot point indicator to trade?
As the basic mantra behind the Woodie Pivot Point is cleared now, we can now focus on how it is used to trade.
The Basic Strategy
Be it even any other form of trade; the basic steps are the same. Those are:
- It is crucial to identify and understand the environment of the market.
- Pick out a valuable area when trading.
- Fetch the entrance and exit points of the trade.
- Finally, it’s time to execute.
The Woodie Pivot Point could be of great assistance for the criteria displayed above. Here’s how it mainly works.
The Market Environment
Every trader who is successful in their field is very well known for the present market trend, whether they do trading using pivot points. There are several ways in which you can be aware of the trend, and one of them is simply taking a look at the chart from time to time. But, this might be a bit complex just in case the window of trading is as small as 1-2 days. So, this is when the Woodie point concept comes to the rescue.
The primary point is, in case the price comes onto the end from upwards, a bearish trend will appear. But, on the other hand, if the price comes to onto from the below, a bullish trend will occur.
Recognize and Finalize trade opportunity
If you have the woodie pivot points on the chart you’re trading with, then the opportunities will exist at or around the resistance and support lines. Along with pivot points, a candlestick strategy can be used to identify the price continuations and reversals.
If the continuation or reversal exists on the line of resistance or support, then there is a probability that you’ve recognized a valuable area through which you should trade.
Decide the entry and exit of a trade.
Your entry point of trade is the area of value you’ve found out. It all relies on the reversal of direction and the trend you would opt between buying or shortening particular security. Just like that, you could use the lines of resistance and support to identify the point of exit.
Say, for instance, in case the price trends upwards while buying, a practical level of profit might be the line of resistance up next. Just like that, you could set stop-loss in connection to the closest line of resistance or support present below the point of entry.
How to launch and handle a trade?
As you place the order, ensure to add in the stop-loss level. Simultaneously, several trading platforms will also permit you to have an automated level of take-profit. After you’ve managed to enter the trade, you can consistently monitor the price level relating to the lines of resistance and support.
The perfect instance would be to watch while the price is approaching your profit level. But in case you get to see a pattern of continuation. Still, you were hoping for a reversal; the following situation might be the perfect chance to adjust the primary take-profit and let it move further ahead.
Are there any advantages of using the Woodie Pivot Point? What are the disadvantages?
Every technical analysis tool has its advantage and disadvantage. When you’re considering enforcing this particular tool in your trading decisions, the following benefits and drawbacks are crucial to consider.
Pros of Trading Using Woodie Pivot Points
- A good amount of importance is granted to the latest price changes while calculating these levels. Therefore, these particular pivot points are highly compatible in risky markets in understood terms.
- Such pivot points behave faster to any changes in the price direction and are therefore suitable for short-period trading.
- Such levels are compatible with implementing and integrating a current trading strategy, functioning better while improvising the dependability of your trades.
Cons of Trading Using Woodie Pivot Points
- Woodie Pivot points aren’t ideal for more extended period traders and investors.
- Such levels work fantastically when combined with other analysis tools but wouldn’t result in trading profitably when used as the only tool.
- Suppose you desire to trade using these particular levels profitably. In that case, you need to get a common understanding and a set strategy right around the levels of resistance and support.
In Conclusion
The lines of resistance and support are the primary terms for explaining the concept behind the technical analysis. The Woodie Pivot is among other methods to bring out the lines and best suits short-term trades conducted during the day.
Use this article as your guide when trading with Woodie Pivot Points. We assure you, you won’t regret it!

He is an expert in financial niche, long-term trading, and weekly technical levels.
The primary field of Igor's research is the application of machine learning in algorithmic trading.
Education: Computer Engineering and Ph.D. in machine learning.
Igor regularly publishes trading-related videos on the Fxigor Youtube channel.
To contact Igor write on:
igor@forex.in.rs
