Table of Contents
As we read in the last article, How to use Ichimoku Cloud in Forex, Ichimoku Cloud is an excellent indicator for JPY pairs and some traders. But there is an interesting question. What are the best Ichimoku indicator settings?
In this article, I created one case study, which you can analyze in my video:


As we know, below are the main Ichimoku components:


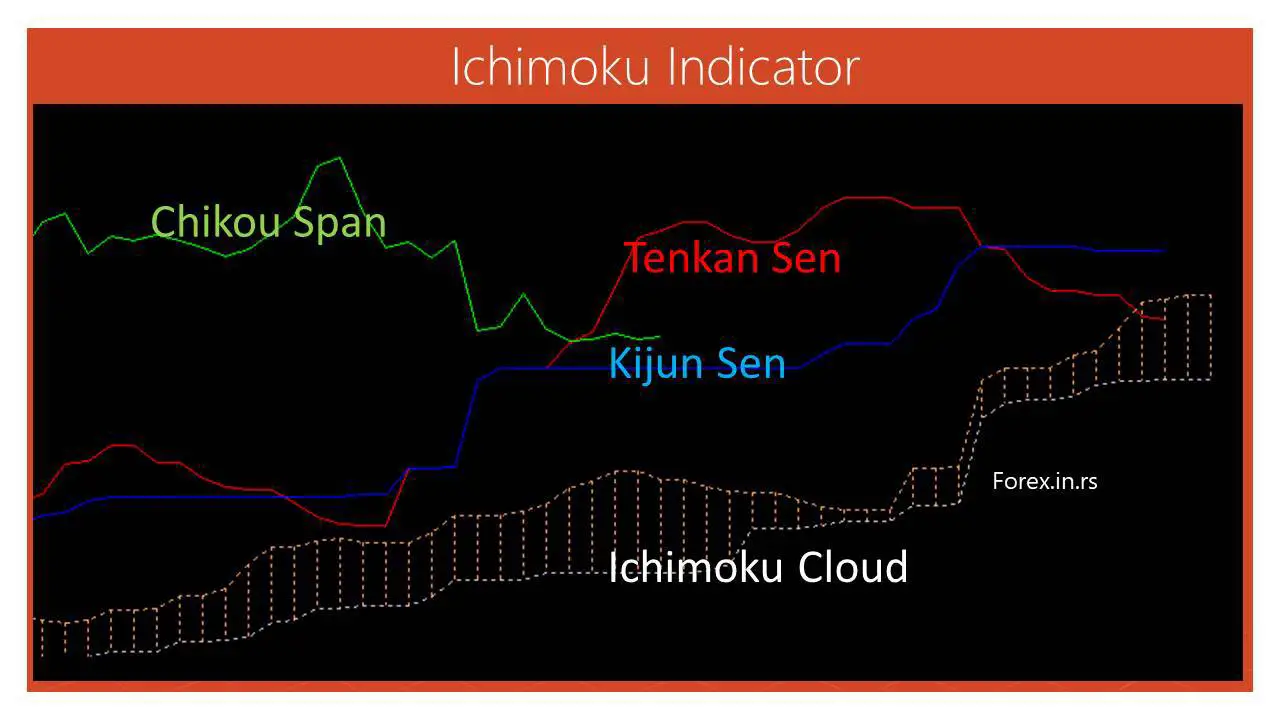
The Ichimoku Cloud indicator consists of five main lines. Here’s a breakdown of each line using color names instead of their traditional Japanese names:
- Blue Line (Originally called Tenkan-sen or Conversion Line):
- It’s calculated by averaging the highest high and the lowest low for the past ‘x’ periods (usually 9 periods by default).
- Represents momentum and provides a mid-point of the last ‘x’ periods, quickly indicating short-term price movement.
- Red Line (Originally called Kijun-sen or Base Line):
- Similar to the Blue Line, it looks back over a longer period, usually 26 periods by default.
- It provides a more longer-term price movement indication and can act as a support or resistance level.
- Green Line (Originally called Chikou Span or Lagging Span):
- It’s the current session’s closing price plotted ‘x’ periods back, usually 26 periods.
- It helps confirm the current trend’s direction.
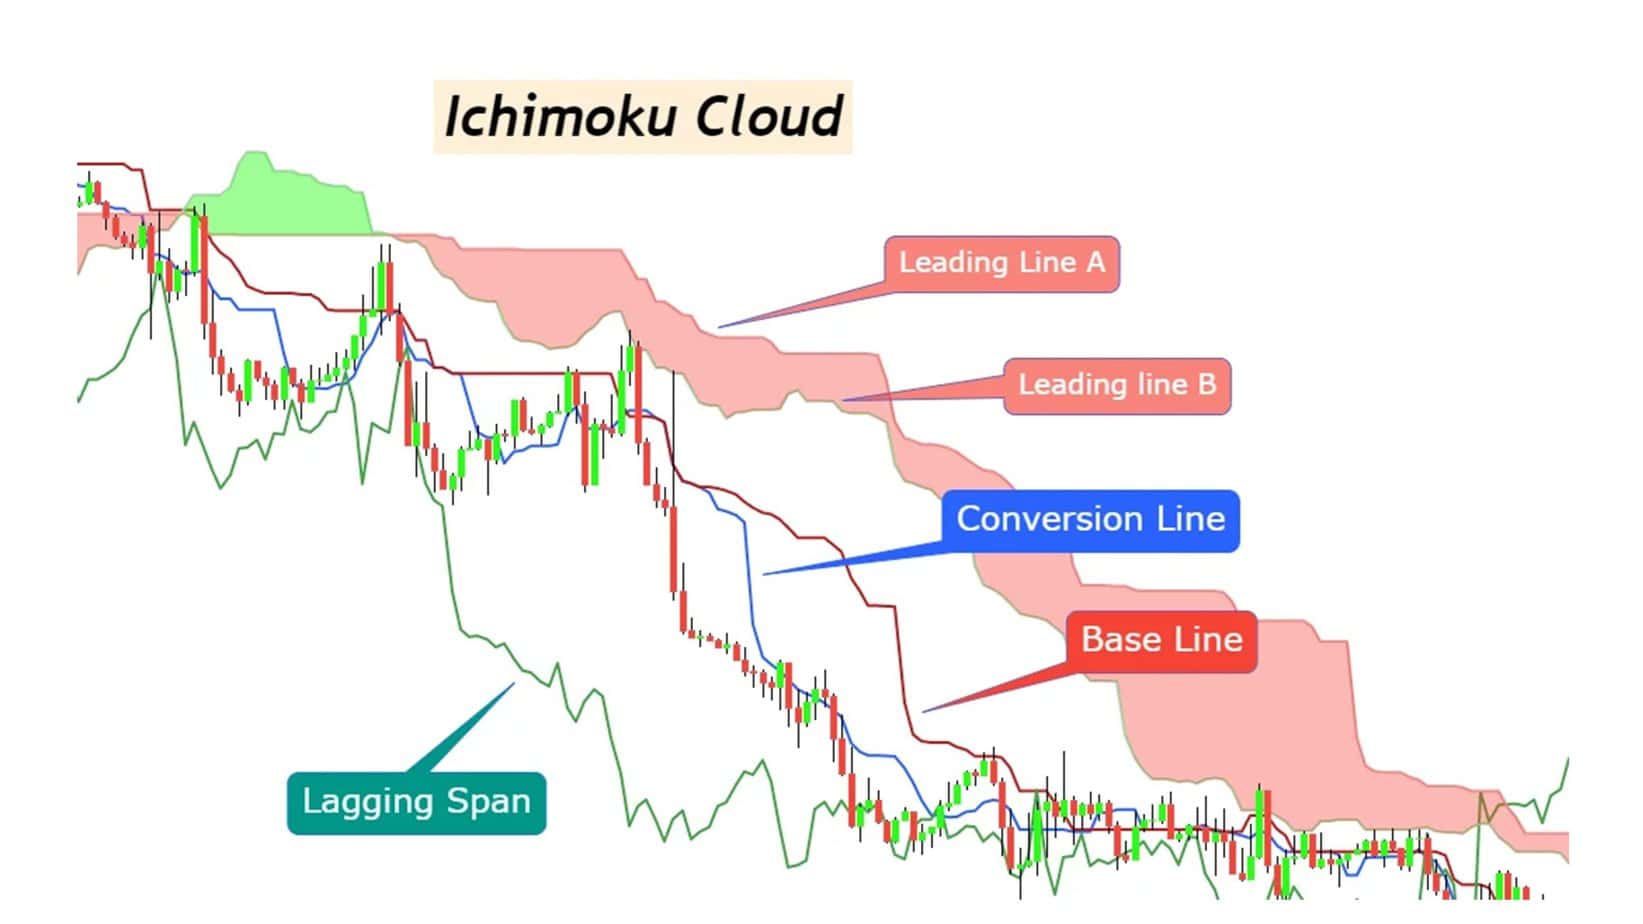
- Light Green Cloud (Part of the Senkou Span or Leading Span, specifically Senkou Span A):
- This line is the average of the Blue and Red lines, plotted ‘x’ periods ahead, typically 26 periods.
- It helps in visualizing potential future support or resistance levels.
- Light Red Cloud (Part of the Senkou Span or Leading Span, specifically Senkou Span B):
- Averaged from the highest high and lowest low over a longer timeframe, usually 52 periods, and then plotted 26 periods ahead.
- Acts as the other boundary of the cloud.
The space between the Light Green Cloud and the Light Red Cloud forms the “cloud” or “kumo.” The cloud serves as a support or resistance zone, and its thickness can indicate how strong the support or resistance is.

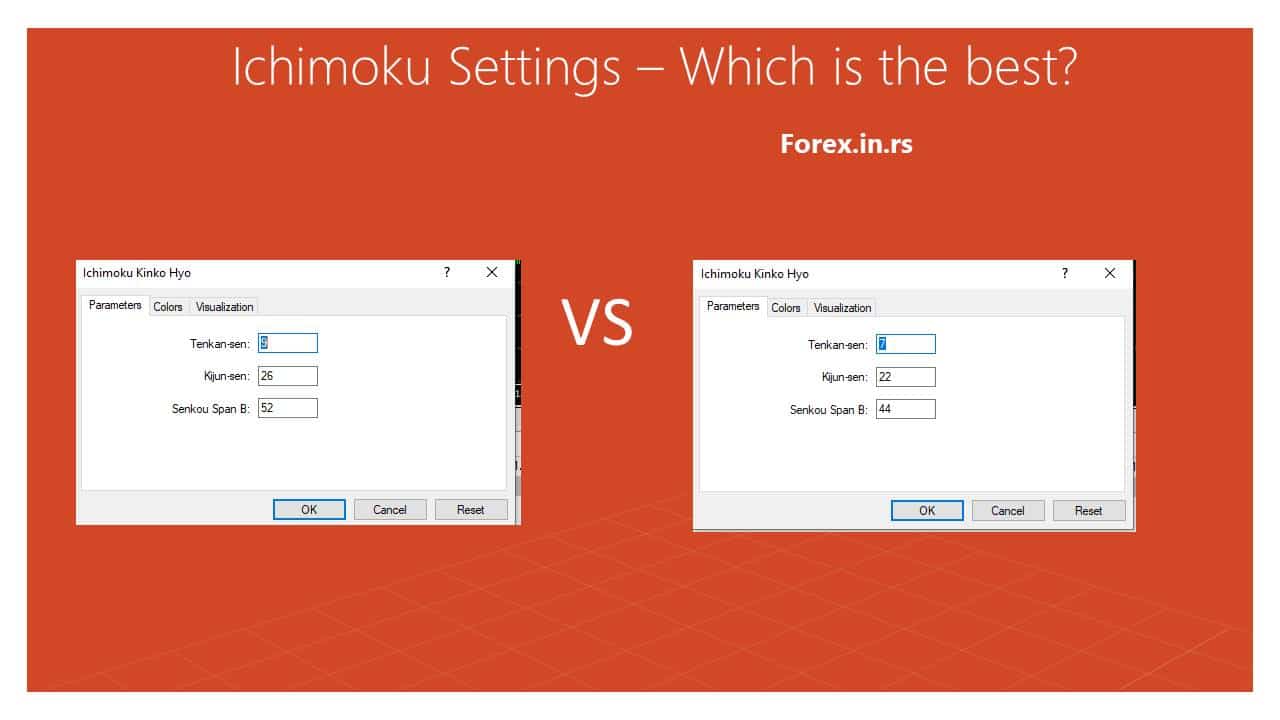
So we want to test two primary Ichimoku settings, 7,22,44 and 9,26,52. How can we do that?
What did we find out when we compared different Ichimoku settings? :
The Ichimoku cloud indicator was created to simultaneously show support and resistance, trend direction, and momentum on the chart. The Tenkan and Kijun Sens lines from the Ichimoku indicator are used as a moving average crossover signal and indicate a trend change. The Ichimoku “cloud” represents current and historical price action and defines the current trend (above the cloud is the rising trend, and below is the downtrend).
Default Ichimoku settings are 9 for the Conversion Line ( Tenkan-sen), 26 for the Base Line (Kyun-sen ), and 52 for the Leading Span B (Senkou Span B). It is several percent better in testing than Ichimoku settings 7 22 44 (Tenkan-sen is 7, Kyun-sen is 22, and Senkou Span B is 44 ). We tested these two most commonly used settings on the Daily chart for 22 years—using significant pairs, EURJPY, GBPJPY, AUDJPY, USDJPY, and NZDJPY.
Ichimoku Settings Case Study
In the case study, we analyzed over 50 websites and looked for various trading settings for the Ichimoku Indicator. We make the following conclusion:
- Crypto Settings:
- Tenkan-sen: 20
- Kijun-sen: 60
- Senkou Span B: 120
- Short-term Trading (For intraday or fast-paced markets):
- Tenkan-sen: 7
- Kijun-sen: 22
- Senkou Span B: 44
- Long-term Trading (For weekly or monthly charts):
- Tenkan-sen: 10
- Kijun-sen: 30
- Senkou Span B: 60
- Forex Settings (Some traders adjust for 24-hour markets):
- Tenkan-sen: 9
- Kijun-sen: 26 or 28
- Senkou Span B: 52
- More Responsive Setting (For catching shorter-term movements):
- Tenkan-sen: 5
- Kijun-sen: 20
- Senkou Span B: 40
- Slower Settings (For reducing noise and catching longer-term trends):
- Tenkan-sen: 15
- Kijun-sen: 30 or 40
- Senkou Span B: 75 or 80
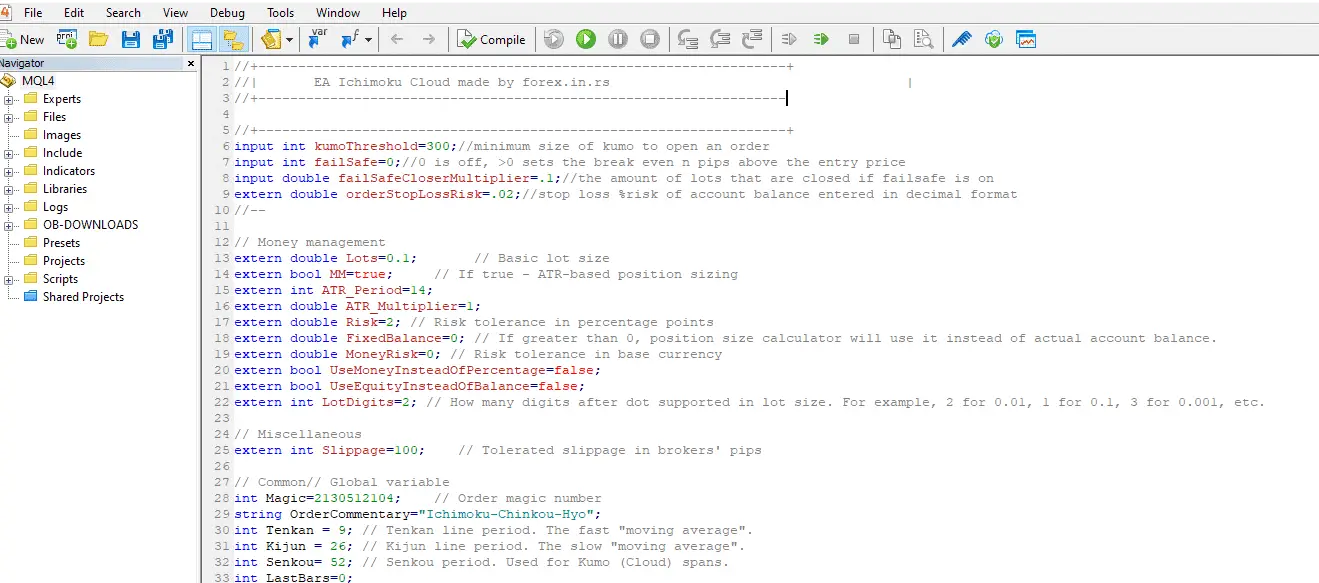
Next, I created Expert Advisor using the most commonly used Ichimoku trading strategy. My goal was to create a profitable strategy, only a fair strategy with a 1:1 risk-reward ratio, where stop loss and target are based on the Daily average true range so my EA would be adaptable on volatility.
Let us see the Ichimoku cloud strategy based on rules for long and short trade:
Rules:
- BUY If the default Red line crosses above the default blue line and both lines, the price is above the cloud on the Chart.
- SELL if the Red line crosses below the Blue line while the price and both lines are found under the cloud.
- Stop-loss set to be related to the Daily Average true range for the last 14 days.
- The target is set to be related to the Daily Average true range for the last 14 days.
In our testing, we have different stop loss and targets for H1, H4, and Daily chart:
- 1 Hour Chart: 25% Daily ATR for stop loss and target
- H4 Chart: 50% Daily ATR for stop loss and target
- Daily Chart: 1 Daily ATR for stop loss and target
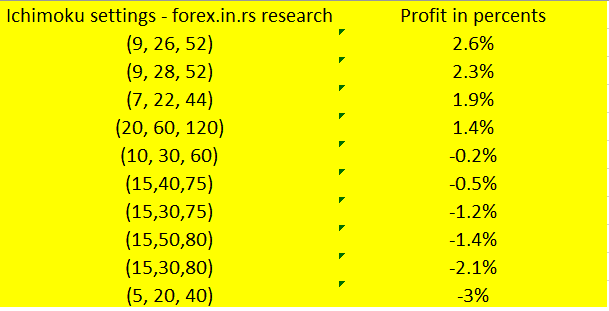
Instead of presenting 15 different Tables, I will present only one based on average results.
After testing, almost 1-4% of results are better using default settings 9,26,52.
See screenshot of result Table:
What are the best Ichimoku settings for forex?
The best Ichimoku setting for trading is 9-26-52. The default Ichimoku settings of 9-26-52 for forex trading showed the best results in the case study. Of course, Ichimoku settings can be adjusted to suit a 5-day week at 7-22-44, then 9-30-60, or 12-24-120 for trending markets.
When we tested Ichimoku standard settings on daily, hourly, and H4 charts, we got an almost 50% winning rate. Usually, Daily Ichimoku systems have the best profitability, where the winning rate is around 54%. We didn’t find any statistical evidence that some settings are better in a short time than in a long time frame.
What are the best settings for the Ichimoku 5-minute chart?
The best settings for the Ichimoku 5 min chart are standard default settings 9-26-52, where nine is for the Conversion Line ( Tenkan-sen), 26 for the Base Line (Kyun-sen ), and 52 for the Leading Span B (Senkou Span B).
In our case study, there is no statistical evidence of which setting is better because the results were very close. However, we saw that performance was worse on the 5-minute chart than on H4 or daily. Hence, we suggest using the Ichimoku indicator on H4, daily, and weekly charts.
What are the best Ichimoku settings for the 1-minute chart?
The best Ichimoku settings for scalping and 1-minute chart are 12-24-120, where 12 is for the Conversion Line ( Tenkan-sen), 24 for the Base Line (Kyun-sen ), and 120 for the Leading Span B (Senkou Span B).
Our case study saw a few percent better results for 12-24-120 settings than standard 9-26-52. This result can be in a larger time frame that settings 12-24-120 occur. We noticed that with a larger time frame, performance is better. Ichimoku Cloud’s best performance for H4, Daily, weekly, and monthly time frames.
Conclusion
In a comprehensive case study, over 50 websites were analyzed to determine the various Ichimoku Indicator trading settings. The study identified specific settings for trading scenarios, such as crypto, short-term, long-term, and forex trading. An Expert Advisor (EA) was then developed, utilizing the most common Ichimoku trading strategy, aiming to achieve a fair strategy with a 1:1 risk-reward ratio.
This strategy used rules for buying and selling based on the positions of the Tenkan Sen and Kijun Sen lines relative to the cloud, with stop-loss and targets adaptable to market volatility using the Daily Average True Range (ATR). The findings revealed that the default Ichimoku settings (9-26-52) performed the best, especially for forex trading.

He is an expert in financial niche, long-term trading, and weekly technical levels.
The primary field of Igor's research is the application of machine learning in algorithmic trading.
Education: Computer Engineering and Ph.D. in machine learning.
Igor regularly publishes trading-related videos on the Fxigor Youtube channel.
To contact Igor write on:
igor@forex.in.rs
