Table of Contents
Ichimoku indicator is one of the various technical indicator systems used by marketers to assess Forex trading markets. It minimizes the losses incurred in Forex trading, thanks to its cloud trading strategy. In this article, we made on.
What is the Ichimoku cloud indicator?
The Ichimoku cloud represents trading indicators that show at the same time on the chart support, resistance, momentum, and trend, and it is a moving average-based trend identification system.


Ichimoku traces its roots from Japan. It is a Japanese candlestick trading technique that was first published in 1969 by Ichimoku Kinkou Hyo. It, therefore, draws its meaning from the reporter’s name. Ichimoku means at a glance, Kinkou implies balance, and Hyo means a chart. It is used to predict the direction of the Price in a given chart. One of the most important decisions that a trader has to make is entering and exiting the market.
Therefore, the Ichimoku candlestick helps traders determine the trend direction to easily choose when to enter or exit the market to prevent losses and maximize profit. In addition, a trader can also resolve the strength of the market signals, which is essential in decision making.
The basic Ichimoku settings for Tenkan-sen is 9, Kyun-sen is 26, and Senkou Span B is 52.
Download Ichimoku cloud
Below you can download Ichimoku cloud indicators:

Download Ichimoku cloud indicator MT4
Ichimoku cloud is the standard default indicator in MT4. However, if you deleted it, you can download the above.
Download Ichimoku cloud breakout alert indicator
Ichimoku cloud breakout alert indicator show on the chart moment to enter into a trade based on breakout and crossover moving average. You can download the indicator above.
Let us see how to trade using Ichimoku cloud :
How to Use Ichimoku Cloud in Forex?
Ichimoku cloud we can use in trading as a trigger for buy and sell signals. Buy signal is presented when the default red Tenkan Sen line crosses above the default blue Kijun sen line, and both lines and the price being above the cloud. Sell signal is presented if the Red Tenkan Sen line crosses below the Blue line while the price and both lines are found under the cloud.
The Ichimoku Cloud indicator is what you need to see the price action vividly. It is used by a range of popular trading platforms and traders due to its relatively high accuracy level. This indicator paints all the tools or components that will help you visualize the price action.
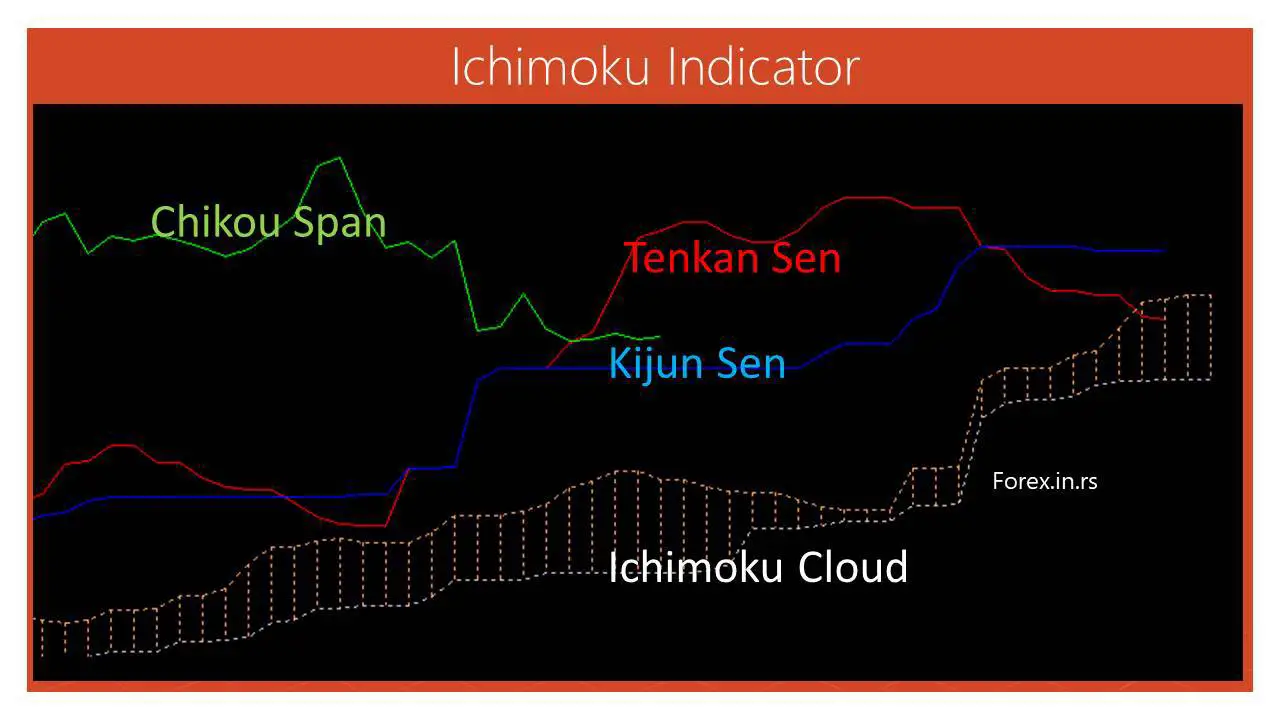
Ichimoku cloud parts
The Ichimoku Cloud indicator comprises five components :
- Tankan-Sen line or Signal line– The Tenkan-Sen line symbolizes the midpoint of the last nine candlesticks. As a result, it is referred to as the line of conversion. The formula is ( 9-period + 9-period low ) /2.
- Kijun-sen line or Baseline– Instead of the last nine candlesticks, the Kijun-Sen line symbolizes the midpoint of the previous twenty-six candlesticks. Its formula of calculation is also similar to that of the Tenkan-Sen line. The formula of calculation is (twenty-six-period + twenty-six-period low) /2. This line is also known as the Base Line.
- Senkou Span A– there also exists a midpoint between the first two indicators. The Senkou Spann A, popularly known as the Leading Span A, symbolizes one of the two cloud boundaries. It is calculated by adding the conversion line and the baseline and then dividing by two. The value you get is usually plotted twenty-six periods in the future, making it the faster cloud boundary.
- Senkou Span B– The Senkou Span B represents the second cloud boundary and is usually referred to as the Leading Span B. This is because it deals with price bars. Therefore, it is the midpoint of the last 52 price bars. It is calculated by adding the 52-period high and the 52-period low, then dividing it by 2. Unlike Span A, this value is usually inserted 52 periods in the future, making it the slower Cloud boundary.
- Chiou Span– The Chiou Span is the lagging span. It falls behind the Price and is usually plotted twenty-six periods ahead.
- Chikou Span– Unlike the Chiou Span, the Chikou Span is usually plotted 26 days behind. It, therefore, signifies the closing price.
Do not be misled by the number of lines into thinking that the Ichimoku cloud indicator is challenging. All you need to do once you understand the different components is to determine which Leading Span is higher. The system shades the cloud component of the graph once it has established the leading spans. A higher Leading Span B indicates an increase in price momentum. As a result, the chart is usually shaded green.
The assets below the Leading Span B also move in a negative direction during such times. As a result, the Cloud is usually shaded red. Therefore, you will quickly determine the course of the market, depending on the Cloud’s colors.
Ichimoku uptrend cloud crossover
The most powerful Ichimoku signal is the Ichimoku uptrend cloud crossover signal when the conversion line moves above the baseline (blue and red line). The closed candle is above the Ichimoku cloud. At that moment, a strong bullish trend can occur. See the chart example below:
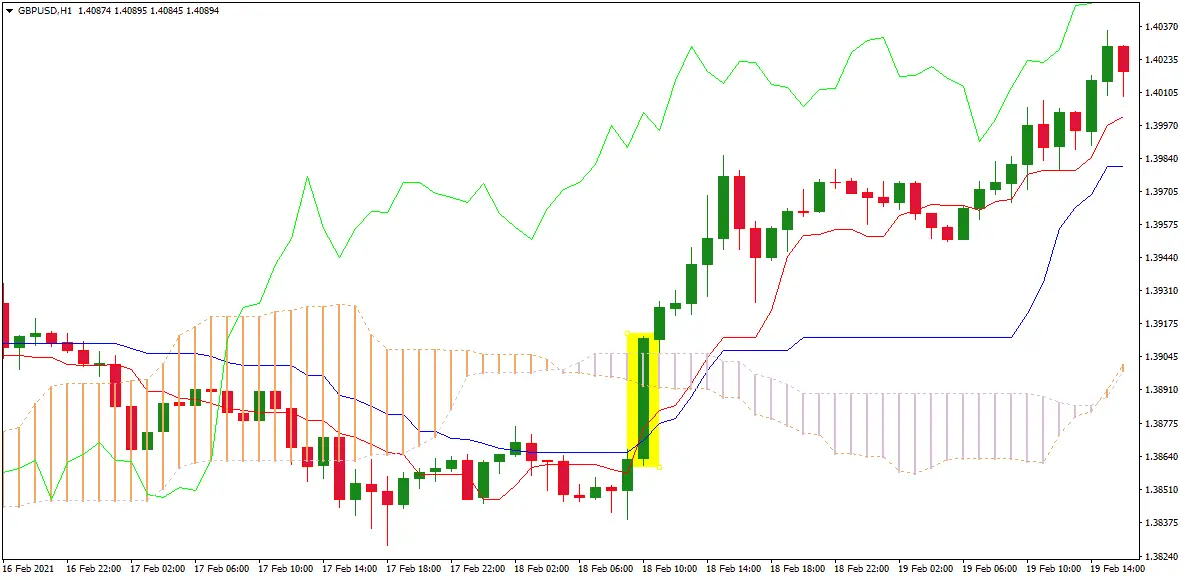
Ichimoku uptrend cloud crossover is presented with a yellow rectangle.
Ichimoku cloud interpretation
The simple way how to interpret the Ichimoku cloud is to watch the cloud (shaded on the chart) that represents the trend because the above is bullish and the below cloud is a bearish trend. Base and signal lines are simple moving averages, and we use their crossover to find the best entry point to enter into the chart. Then, you only need to observe the position of the Price about the Cloud. A price above the Cloud signifies a bullish trend, whereas a price below the Cloud signifies a bearish trend. The Price can also fall in the middle, which usually means a consolidating pattern. The trend can, therefore, move in any direction.
You will also notice different bullish and bearish signals and their strengths. As a result, a bullish signal is generated anytime the Tenkan crosses Kijun from underneath. On the other hand, any time the Taken passes the Kijun from above, a bearish signal arises.
Strength of the Ichimoku trading signals.
Three factors determine the strength of the Ichimoku trading signals. These are the distance of the price movement, Chiou span, and the Cross-over about the Cloud. For a strong bullish signal, the lagging span and the Price are usually far from the crowd, whereas the Crossover maintains a relatively suitable distance from the Cloud.
The typical Ichimoku chart is different from a simple moving chart. It can detect the changes in support and resistance, usually determined by observing the two leading Spans’ relationship. A green color indicates a bullish trend, whereas a red color indicates a bearish trend. The Cloud also matters, and as a result, a smaller cloud signifies a weaker strength.
Traders from all over the world use Ichimoku. However, it mainly suits day traders or people who need to enter or exit the market quickly. It does not work alone, and most of the time, it is paired with the Relative Strength Index for better strength and support signaling. This trading technique, however, needs a degree of discipline. A trader must be patient enough to wait for the best signal before making a decision.
Now that we have looked at what this technique entails, it is only right that we see how you can use it in your trade.
This cloud system ensures that traders assume the right side of the market at all times. Therefore, the rules are put in place to help forex traders and marketers follow all the trends until a reversal is imminent. Due to its nature, the Ichimoku trading system is best suited for swing traders. There is no specified time that you need to buy. Just go with what works for you. This system uses the swing trading strategy, which plays a vital role in maximizing profits by minimizing losses.
Ichimoku cloud trading steps:
- Price break
Before you trade, the first thing to do is make sure that the price breaks and closes above the Ichimoku cloud. The Price trading above the Cloud signifies a bullish trend, which is the beginning of a new uptrend. The Ichimoku cloud shows both the support and resistance levels, and since the two are not single lines, it usually highlights several layers.
Any break concerning the Ichimoku cloud signifies a shift in the market. Before you decide on anything, make sure that the chart shows more layers. This is the first indication of a high probability trade setup.
- Crossover
Once you have realized more layers of confluence, the next thing is to wait for the Crossover. By this, the conversion line has to break above the baseline. Once the price breaks above the Cloud and a crossover follow, you can enter a new trade.
- Entering a trade
When using the Ichimoku trading system, it is only advisable to enter a trade when the price is trading above the Cloud. The next step after the Crossover is buying, which usually occurs when the next candle opens.
- Placing a stop loss
It would be best if you had a stop loss after placing a trade. Once you have bought at the next candle’s opening, the next process determines where to place the protective stop loss. Th stop loss should be placed beneath the low of the breakout candle. This technique minimizes big losses in case you are wondering why. It also ensures that trade follows the market flow.
You can quickly exit the position once another crossover happens but in a different direction once the stop loss prevention is in place.
- Taking profits
It is only right that you exit the market when the conversion line crosses below the baseline. You can also leave the trade up to when the Price breaks below the Cloud. However, this is a gamble, and you might end up losing a part of your profit even as you gain.
The same rule also applies during selling; just that this time, you will have to do it in reverse.
CONCLUSION
The Ichimoku Trading technique helps traders find support and resistance, which is crucial in technical analysis. You will also get to easily identify and jump into any trend that you deem profitable. All you need is a high degree of discipline and patience to identify the right time to enter a trade. It is, therefore, one of the easiest yet highly accurate trading indicators.

He is an expert in financial niche, long-term trading, and weekly technical levels.
The primary field of Igor's research is the application of machine learning in algorithmic trading.
Education: Computer Engineering and Ph.D. in machine learning.
Igor regularly publishes trading-related videos on the Fxigor Youtube channel.
To contact Igor write on:
igor@forex.in.rs
Related posts:
- Best Ichimoku Settings Case Study! – Is Ichimoku Settings 7 22 44 Profitable?
- What is EMA Indicator?
- Download SSL Channel Indicator For MT4!
- Download Half Trend Indicator MT4
- Download Forex Reversal Indicator for MT4
- Balance of Power Indicator and Strategy – BOP Indicator
- Schaff Trend Cycle Trading System – Cycle Indicator MT4 Download
- RSI Filter Indicator – Free Download
- Free Download True Strength Index TSI Indicator
- Download Chandelier Exit Indicator!
- Download Chaikin Money Flow Indicator for MT4
- FX Vortex Indicator Free Download
