Table of Contents
Forex trading is a trader’s best friend as it offers not only one but many opportunities. It is not hidden that everything comes with its drawbacks, but the benefits of forex trading have the upper hand. One benefit that attracts traders towards forex trading the most is its liquidity. Forex liquidity makes it the trader’s favorite in the security market. First, however, one must understand the Forex liquidity strategy due to unforeseen variations in the Forex Market.
As stated in a 2023 triennial report by the Bank of International Settlements, forex liquidity is around $8 trillion daily.


What is forex liquidity?
Forex liquidity represents trading volume. High liquidity in the Forex market, characterized by many buyers and sellers, ensures that currency trades can be completed swiftly and efficiently. Liquidity significantly influences the spread, with more liquid markets having narrower spreads due to a higher price agreement among the numerous market participants.


Major currency pairs like USD, EUR, GBP, and JPY exhibit high liquidity, reflecting their extensive trading volume, economic stability, and less price volatility, even with large trades.
Forex Liquidity characteristics:
- High Liquidity: A highly liquid Forex market or currency pair has many buyers and sellers at any given time. This high level of participation ensures that trades can be executed quickly and efficiently.
- Impact on Spreads: Liquidity affects spreads (the difference between the bid and ask price). In a liquid market, the spread is usually narrower, meaning it costs less to trade. This is because the high number of participants leads to a closer agreement on the price at any given moment.
- Major Currency Pairs: The most liquid currency pairs typically include major world currencies like the USD, EUR, GBP, JPY, and others. These pairs have the highest trading volume and are traded around the clock, contributing to their liquidity.
- Market Impact: In a liquid market, large trades can be executed without significantly impacting the price. Conversely, even smaller trades can move prices more dramatically in a less liquid market.
- Economic and Political Stability: The liquidity of a currency is often linked to its country’s economic and political stability. More stable countries tend to have more liquid currencies.
- Time of Day and Geographical Factors: Liquidity can vary throughout the trading day, peaking when major trading sessions overlap, such as when both London and New York markets are open.
Forex liquidity refers to the ability of a currency pair to be bought or sold in the market without causing a significant movement in its price. In other words, it’s the ease with which a currency can be traded for another.

See my video:
The most liquid currencies are typically those of countries with stable governments, reputable financial institutions, and high levels of economic activity. For example, the most liquid currency pair is the EUR/USD (Euro/US Dollar), followed by USD/JPY (US Dollar/Japanese Yen), and GBP/USD (British Pound/US Dollar).
Forex liquidity is crucial because it impacts how easily you can enter or exit trades. If a currency pair has high liquidity, it means that there are a lot of participants in the market willing to trade that pair, making it easier for you to buy or sell without significantly affecting the price. This is typically associated with lower spreads (the difference between the bid and ask prices), which can benefit traders.
On the other hand, currency pairs with low liquidity may have higher spreads. As a result, they could be more volatile, meaning prices can change rapidly quickly, making it possible for investors to experience significant profits or losses. Low liquidity can also lead to slippage when a trade is executed at a different price than expected.
How do you find liquidity in forex?
To find liquidity in forex, traders use indicators to describe the trading volume of a particular asset and indicators to identify forex liquidity zones, which traders call supply and demand zones.
To measure trading volume, traders use:
- Chaikin’s cash flow (CMF) ;
- Mass Index Oscillator;
- Money Flow Index (MFI);
- On Balance Volume (OBV);
- Percentage Volume Oscillator (PVO)
- Price change rate (ROC);
- Volume Zone Oscillator (VZO);
- Volumes;
The highest liquidity has forex pairs that have higher trading volume!
Find Liquidity Zones in a Chart
Finding liquidity zones (supply and demand zones) in forex charts is crucial to understanding where large amounts of buy or sell orders may exist. In addition, these zones can provide insight into potential future price movements. Here are the steps to find liquidity zones:
- Identify Swing Points: Identify your chart’s major swing highs and lows. These are the points where price has reversed direction in the past. It’s usually best to start with a higher time frame chart, like the daily or weekly, to identify significant swing points.
- Draw the Zones: Once you have identified the swing points, you can draw the liquidity zones. These are usually horizontal zones encompassing the area around the swing point. Some traders will draw the zone from the high to the low of the candle that created the swing point, while others might use a certain number of pips above and below the swing point.
- Look for Reaction: After drawing the zones, observe how the price behaves when it returns to these zones. A strong rejection could indicate that there is still a lot of liquidity (unfilled orders) at that level. On the other hand, if the price slices through the zone without any reaction, it could mean that all the orders at that level have been filled, and the story may not act as support or resistance in the future.
- Consider the Overall Trend: Liquidity zones can support an uptrend and resistance in a downtrend. However, remember that just because a price reaches a liquidity zone doesn’t mean it will reverse. Therefore, the overall trend and other factors like economic news releases could always impact price.
- Patience and Confirmation: Waiting for the price to react to a liquidity zone and confirm its strength can often be beneficial, rather than preemptively placing trades at these levels. Some traders look for specific price action patterns, like pin bars or engulfing candles, to confirm that a zone has held.
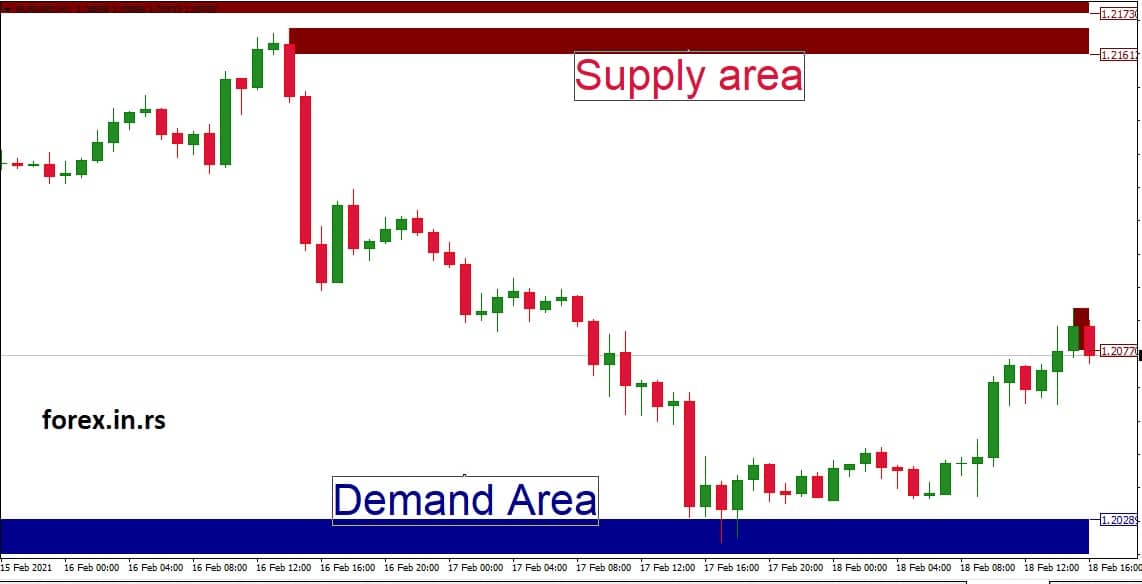
Supply and demand zones on forex charts are where the currency pair can strongly react upwards or downwards.
- Demand Zone: This is a price zone or level where the demand for a currency pair has historically outstripped supply, causing the price to rise. In other words, buyers were more aggressive and willing to buy at higher prices, pushing the price up.
- How to identify: Demand zones are usually located below the current price action and can be identified after a sharp price rise. They are often associated with consolidation areas before a big upward move or after a sharp decline where prices made a strong recovery.
- How to use: Traders consider demand zones as potential “buy” areas, expecting that if the price returns to this level, the strong buying pressure will return and push the price up. It’s also a place where traders might consider placing stop-loss orders below the zone to limit potential downside risk.
- Supply Zone: This is a price zone or level where the supply of the currency pair has previously exceeded demand, causing the price to fall. This means sellers were more aggressive and willing to sell at lower prices, pushing the price down.
- How to identify: Supply zones are typically located above current price action and can be identified after a sharp price drop. In addition, they are often associated with consolidation areas before a big downward move or after a sharp rally where the price made a strong reversal.
- How to use: Traders consider supply zones as potential “sell” areas, expecting that if the price returns to this level, the strong selling pressure will return and push the price down. It’s also a place where traders might consider placing stop-loss orders above the zone to limit potential upside risk.
In both cases, the “sharp” price movement away from these zones indicates a muscular imbalance between buyers and sellers, so prices quickly moved away. The assumption is that there are still unfilled orders at these levels, and when the price returns to the zone, these orders will be filled, causing the price to move away again.
The reliability of these zones can depend on various factors such as the time frame (higher time frame zones are generally more reliable), the volume of trading at these levels, and how price left the zone (a strong and quick move away is usually a good sign).
It’s important to note that supply and demand zones are not exact price levels but areas or zones on the chart. Also, not every supply and demand zone will work perfectly. As with any trading strategy, there are no guarantees, and traders should use other forms of analysis and risk management to improve their trading decisions.
You can use an indicator that can automatically draw supply and demand zones!
High Liquidity Forex Pairs
Forex pairs are categorized based on their trading volume. The most liquid pairs are traded in the highest volume. This increased liquidity generally results in lower spreads, which benefits traders. Here’s a list of some of the most liquid forex pairs:
- EUR/USD (Euro/US Dollar): This is the most traded pair in the forex market, making it the most liquid. It represents two of the largest economies in the world. The high liquidity of this pair results in tight spreads and allows traders to enter and exit their positions at a low cost.
- USD/JPY (US Dollar/Japanese Yen): This pair is the second most traded. The Japanese economy is the third largest national economy, and the Yen is a significant reserve currency. The USD/JPY pair is known for its liquidity and tight spreads.
- GBP/USD (British Pound/US Dollar): Known as “Cable,” this pair represents two significant economies. The GBP/USD pair is highly liquid, especially during the European trading session.
- USD/CHF (US Dollar/Swiss Franc): This pair is highly traded because the Swiss Franc is considered a “haven” currency. It is highly liquid, especially in times of economic uncertainty.
- AUD/USD (Australian Dollar/US Dollar): Australia has a robust commodity-based economy, and the AUD/USD pair is often traded based on the price of gold and other commodities. It is a highly liquid pair, especially during the Asian trading session.
- USD/CAD (US Dollar/Canadian Dollar): Known as the “Loonie,” the price of crude oil influences this pair, as oil is one of Canada’s main exports. The USD/CAD pair has good liquidity and is often traded during the North American trading session.
- NZD/USD (New Zealand Dollar/US Dollar): The NZD/USD pair, also known as the “Kiwi,” is influenced by the price of commodities, including dairy products and metals. Consequently, it is most liquid during the Asian and Pacific trading sessions.
- EUR/JPY (Euro/Japanese Yen): This pair is widely traded, especially in Asia. It is known for its volatility and liquidity.
These pairs are the most liquid due to the size of the economies they represent and the amount of trade involving these currencies. However, while high liquidity can be beneficial, it can also lead to higher volatility, especially during major economic announcements. Therefore, it’s important to understand forex market dynamics and a solid trading strategy when trading these pairs.
Low Liquidity Forex Pairs
Forex pairs that are the least liquid are typically called “exotic” pairs. These pairs involve currencies from emerging or smaller economies or less frequently traded currencies. As a result, they often have wider spreads and may be more volatile due to lower trading volumes. Here are a few examples:
- USD/SEK (US Dollar/Swedish Krona): Although Sweden has a strong economy, the Swedish Krona is not a commonly traded currency. This pair has less liquidity than major pairs and can have wider spreads.
- GBP/ZAR (British Pound/South African Rand): The South African Rand is considered an exotic currency. Trading volume is lower, and the spread can be comprehensive due to the currency’s volatility and lower liquidity.
- USD/TRY (US Dollar/Turkish Lira): The Turkish Lira has been quite volatile in recent years due to economic instability. As a result, this pair is less liquid and can have wide spreads.
- EUR/HUF (Euro/Hungarian Forint): This is another pair with less liquidity. The Hungarian Forint is not a heavily traded currency; the spread can be vast.
- USD/RUB (US Dollar/Russian Ruble): The Russian Ruble is considered an exotic currency and is impacted by political and economic factors in Russia. This pair is less liquid and can have wide spreads.
- JPY/NOK (Japanese Yen/Norwegian Krone): The Norwegian Krone is not a widely traded currency, making this pair less liquid. The spread can be more comprehensive, especially during lower market liquidity.
- AUD/MXN (Australian Dollar/Mexican Peso): The Mexican Peso is considered an exotic currency, and this pair is not commonly traded. It can have wider spreads and lower liquidity.
- NZD/SGD (New Zealand Dollar/Singapore Dollar): Both these currencies are less commonly traded, resulting in lower liquidity for this pair.
Remember, trading fewer liquid pairs can come with increased risks, including wider spreads, higher volatility, and increased susceptibility to market manipulation. It’s also harder to enter and exit positions due to the lower trading volume. So always use proper risk management when trading forex, and consider your level of experience and risk tolerance.
Difference Between Forex Liquidity and Illiquidity
The difference between forex liquidity and illiquidity is in overall pair volume, wherein liquidity market volume is moderate to high. In contrast, in the liquidity marker,t there is no demand or supply, volume is deficient, and it is tough to make instant market trade. The trading price range is very low in the market’s illiquidity, and the price does not frequently change over time.
The smoother the price action, the more liquid forex trading is. Also, the buying and selling of the currency pair are less chaotic. This highly liquid market is called a plunging market.
On the other hand, the illiquid market is very chaotic due to the uncertain volume of currencies traded at a particular time. The illiquid market is precarious as traders can lose a significant volume if they do not trade on the right side of the illiquid market.
Conclusion
The significance of forex liquidity is highlighted by the fact that it attracts traders due to its high liquidity, as evidenced by the daily turnover of approximately $8 trillion in the forex market. Liquidity in forex represents the ease with which currencies can be bought or sold without causing substantial price movements. High liquidity is typically associated with major currency pairs, leading to lower spreads and facilitating easier trade entry and exit.
Traders use indicators and techniques to identify liquidity zones, such as supply and demand, to gauge potential price movements. Highly liquid forex pairs, like EUR/USD and USD/JPY, are favored for their lower spreads and ease of trading. Conversely, exotic pairs with low liquidity may have wider spreads and increased volatility.
The difference between forex liquidity and illiquidity lies in the trading volume and price stability. Liquid markets have moderate to high trading volumes, resulting in smoother price action and less chaos. In contrast, illiquid markets lack demand and supply, leading to uncertain trading volumes and increased risk.

He is an expert in financial niche, long-term trading, and weekly technical levels.
The primary field of Igor's research is the application of machine learning in algorithmic trading.
Education: Computer Engineering and Ph.D. in machine learning.
Igor regularly publishes trading-related videos on the Fxigor Youtube channel.
To contact Igor write on:
igor@forex.in.rs
Related posts:
- What is Liquidity Zone in Forex?
- What is a Liquidity Grab in Trading?
- How to Trade Supply and Demand Zones?
- How to Draw Supply and Demand Zones?
- S&P 500 Trading Hours! – SPx500 Market Hours in Different Time Zones!
- Forex Chart Pattern Indicator Free Download
- Investor Sentiment Index – Investor Poll Free Chart
- Getting Started in Chart Patterns – Top Chart Patterns
- 30 Second Chart Trading
- Hollow Candle Chart
- What is Naked Chart Trading?
- Best Moving Average for 4 Hour Chart
