Table of Contents
Some traders base their trading strategies on fundamental analysis; some use technical analysis, while others use both. Technical analysis is more famous among stock market traders. They use several technical indicators and tools to add to their daily charts to analyze market trends and price movements. While tools and indicators are excellent, trading strategies alone cannot be based on these. A more comprehensive way of technical analysis is using a chart like the naked chart. Many indicators deem this the ultimate alternative to using several tools and indicators. Let’s see how a trading chart can help you.
What is Naked Chart Trading?
Naked charts represent simple trading charts without indicators. Naked trading, or “indicator-free” trading, is a technique without technical indicators where traders use only candlesticks and price levels as trading triggers.


Below is an example of one snaked strategy where chart patterns are the only trigger for trade execution:


Trading forex without indicators or naked forex trading is buying and selling assets using price levels as the main trading criteria. Forex no indicator trading is usually based on the current market conditions when traders use price levels to enter and exit trades, such as Fibonacci levels, support, resistance, pivot points, and price levels from chart patterns.
“Naked” charting and trading refers to making trading decisions based purely on price actions and levels without using any technical indicators. Traditional technical indicators might include tools like Moving Averages, Bollinger Bands, MACD, RSI, etc. When a trader decides to go “naked,” they’re essentially stripping the chart of these additional indicators and focusing solely on the price data.
Those who believe in the pure price action philosophy favor this kind of trading, which asserts that all necessary information for making a trading decision is contained within the price data itself. The idea is that price is the most current and accurate reflection of all market information and sentiment and should therefore be the primary focus of any trading strategy.

Please see my opinion about naked trading in my video:
Here are the critical components of naked trading:
- Candlestick patterns: Candlestick charts are a type of financial chart used to describe the price movements of a security, derivative, or currency. Each “candlestick” typically shows one day; thus, a one-month chart may show the 20 trading days as 20 candlesticks. Candlestick patterns can give much information about potential reversals or continuations in the market.
- Support and Resistance Levels: These are price levels at which a currency pair has historically either risen or fallen and then reversed direction. Support is a level that a price has trouble falling below without at least two attempts, while resistance is a price level that a currency pair or other market has trouble exceeding.
- Fibonacci Levels: Fibonacci retracement levels are horizontal lines indicating potential market support or resistance levels. They are based on Fibonacci numbers, a sequence identified by mathematician Leonardo Fibonacci in the 13th century. Each number in the Fibonacci sequence is the sum of the two numbers before it.
- Pivot Points: Pivot points are technical analysis indicators that forecast market trends and price levels that could potentially be significant. They are calculated based on the previous trading period’s high, low, and closing prices.
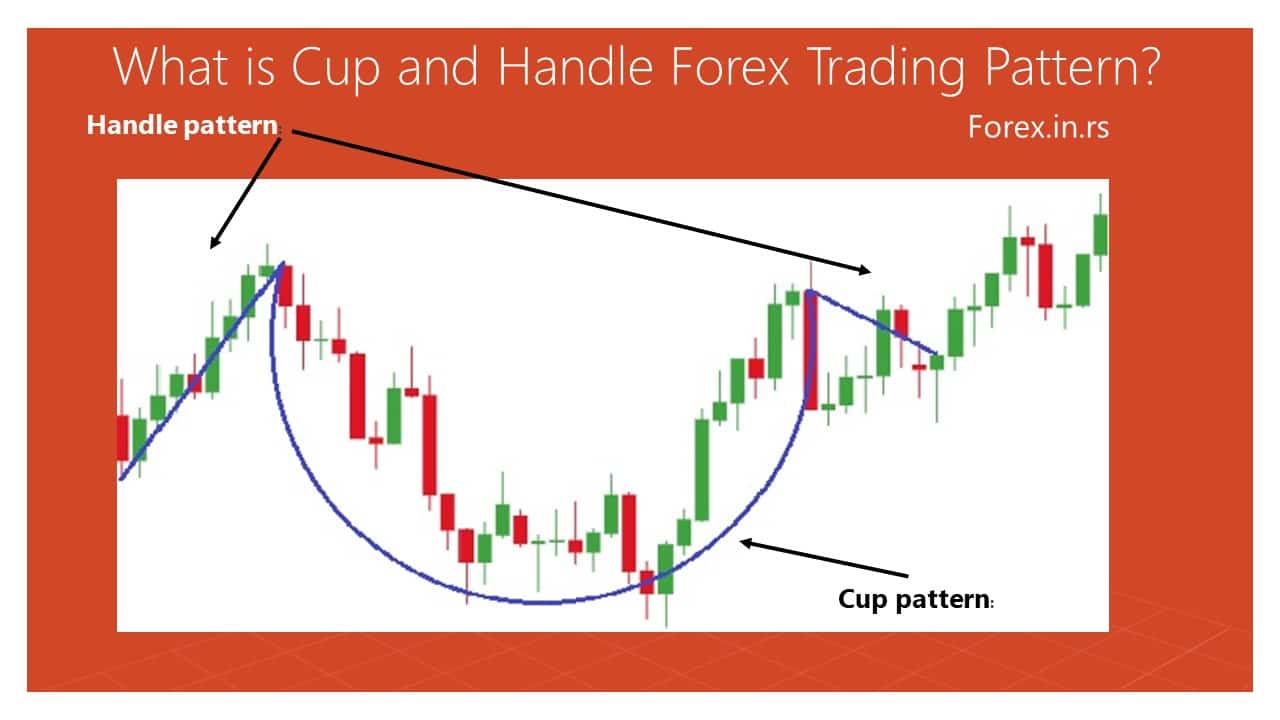
- Chart Patterns: There are various chart patterns that traders recognize and use as signals for potential future market movements. These include patterns like head and shoulders, double tops and bottoms, triangles, flags, and more.
Remember that while naked trading can help simplify the trading process and reduce the potential for “analysis paralysis,” it also requires a strong understanding of price action and market psychology. Also, like all trading strategies, it is not foolproof and can still result in losses. Therefore, risk management remains a crucial component of a successful trading strategy.
Unlike the practice of adding indicators to your daily trading charts, the naked chart will allow you to trade every day without focusing on any indicator. Naked Chart Trading is related to Price Action Trading as it focuses on real-time price trends than anything else. Price action is the movement of a security’s price plotted over time. Simple candlestick charts are used along with distinct patterns such as pin bars.
This might sound simple, but this is precisely what the experts advise. Traders often get overwhelmed by several indicators. They keep adding these indicators to their charts and create clutter to avoid missing anything. Trading can be done efficiently with clear charts, and your mind is not running in different directions. This is precisely what a naked chart makes possible. Trading can be taxing, and seeing several lines over your screen will only increase your psychological burden. Naked charts are simple and proficiently tell you about price movements.
Data that concentrates mainly on price action is anyway considered superior. If you are still confused, let us clear this up for you. Indicators are nothing but derivatives of these price movements or actions. Experts often label them lagging because they do not provide complete and accurate information. Yes, they help traders identify possible reversals and trends. Still, to form a rewarding trading strategy, you should consider naked charts or price action if you want to use an indicator.
How to Trade Without Using Indicators
Many traders rely heavily on indicators and end up making a mess. Trading without indicators is possible and highly practical. All you need to do is to understand the market structure and study its momentum. This is how you can do it:
1. Identify the Market Direction:
The market structure is made of swing highs and lows. A trader must know about these highs and lows to understand the market direction. Their order of occurrence creates signals that allow you to determine the market’s direction. Using these highs and lows, you can identify whether the market is bearish or bullish. You will be able to capture new trends as well.
Identifying swings requires practice and knowledge. There are highs and lows, which are further segregated into four parts. Highs can be higher highs or higher lows. Similarly, lows can be higher lows or lower lows. This is how you identify trends using these four terms:
- If the higher highs are persistent and are followed by higher lows, you have an uptrend.
- If the lowers lows are persistent and are followed by lower highs, you have a downtrend.
- There is a third option with no set pattern of swings, called a consolidating trend.
You can easily find out a trending market by analyzing these charts. Don’t beat yourself up trying to make sense of those complicated indicators. You will get a buy signal when the higher highs and lows continue, as it depicts a bullish trend. You will get a sell signal when the lowers and lows continue as it depicts a bearish trend.
You can also see neutral or ranging market conditions along with clear highs and lows. These are not desirable conditions. When the price levels show both highs and lows simultaneously at the same level, the prices are stuck between two levels. In this condition, swing points are identified in the same area. It is tough to spot the chances of reversal.
Spot Reversals Using a Naked Chart
Resistance and support levels can help traders identify possible reversals. These can be spotted using charts. Trend lines and horizontal levels are also helpful when spotting price reversals. Some traders and investors also resort to Fibonacci levels for the same. All of the above can create two possible scenarios. First, prices will move continuously along the significant support levels and then make a U-turn. The other possibility is that prices retrace along with the old support levels. They use a new resistance level to make the reversal possible.
You can easily spot reversals by identifying necessary support, resistance levels, and uptrends.
Catching Trade Signals
Charts are highly reliable when it comes to generating buy and sell signals. Candlestick patterns highlight reversals in naked charts.
Naked Chart Trading vs. Indicators
Naked Chart Trading:
- Current Information: Naked charts provide real-time, up-to-the-minute information about price action. Traders can quickly react to market changes based on these primary data.
- Less Cluttered Interface: Without the overlay of multiple indicators, the chart is less cluttered, simplifying analysis and decision-making processes.
- Historical Data: Naked charts allow traders to view historical price action patterns, enabling a study of how the market has moved in the past. This can be used to predict future trends.
- Skills Development: Traders using naked charts have the opportunity to develop their skills in reading and interpreting charts, which can be more beneficial in the long run than relying solely on indicators.
- Herding Issue: Many traders may adopt the same strategy when price actions create apparent signals. This herding effect can sometimes reduce profitability.
- Risk of Blank Charts: Occasionally, the chart offers no clear direction, leading to analysis paralysis or incorrect decisions.
Using Indicators:
- Clear Signals: Indicators can provide clear and objective trading signals, which can be particularly helpful for new traders who may find chart interpretation challenging.
- Lagging Nature: Indicators often use historical data and can lag current market conditions. This delay could lead to missed opportunities or erroneous decisions.
- Overuse Issues: Using too many indicators can create a cluttered, confusing chart and make interpretation challenging.
- Valuable Reference Points: During periods of unclear price action on naked charts, indicators can offer valuable reference points that can guide trading decisions, saving time and potentially mitigating risk.
- Reliance on Predefined Formulas: Indicators are based on predefined mathematical formulas that might not account for current market dynamics or sudden changes in market sentiment.
In summary, both approaches have their strengths and weaknesses. The best approach for an individual trader will largely depend on their trading style, experience, and personal preferences. Some traders might prefer the simplicity and immediacy of naked charts, while others might find value in the additional guidance provided by indicators.
Traders fear losing information and keep adding indicators to their charts to avoid that. This is a big mistake as it will lead you nowhere. You are in a more advantageous position if you are relying on trading charts. By developing skills to read charts, you can have a more practical approach than relying on intuition, which is what trading via indicators is about. However, we cannot neglect that indicators are there for a reason and can be helpful when used rightly. This is how naked charts are different than indicators:

He is an expert in financial niche, long-term trading, and weekly technical levels.
The primary field of Igor's research is the application of machine learning in algorithmic trading.
Education: Computer Engineering and Ph.D. in machine learning.
Igor regularly publishes trading-related videos on the Fxigor Youtube channel.
To contact Igor write on:
igor@forex.in.rs
Related posts:
- How to Get Funded for Forex Trading?
- Evaluating My Forex Funded Account: $9000 Profit After 1 Month Of Trading
- 30 Second Chart Trading
- How to Avoid Instant Funding Prop Firms Trap?
- Forex No Indicator Trading – How to Trade Forex Without Indicators?
- How to Get Instant Funding to Manage Up to 2 Million Dollars?
- Trading Forex For a Living is Realistic in 2024!
- What is Funded Account in Forex?
- Hollow Candle Chart
- Getting Started in Chart Patterns – Top Chart Patterns
- Flag Pattern Trading – Bearish and Bullish Flag Chart Pattern
- What is a Forex Demo Trading Account?
