Table of Contents
A highly liquid market allows large trade volumes without a significant price change. In contrast, a less liquid market may experience more significant price swings for smaller volume trades.
What is Liquidity Zone in Forex?
A liquidity zone in forex trading represents a price range area with high trading volume. The liquidity zone has a prominent concentration of active and pending buy and sell orders. Liquidity zones can act as magnets for price, as the large order sizes present at these levels can influence price direction when reached. For example, previous low and high prices are usually in liquidity zones.


In trading, previous support can become resistance and vice versa. In previous support and resistance levels, we can see liquidity zones:


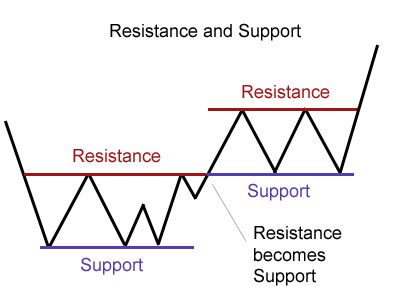
Main characteristics of liquidity zones:
- Order Execution: For major institutional traders, executing large orders without drastically affecting the market price is crucial. Liquidity zones provide the depth required to facilitate such transactions without massive price swings.
- Price Magnets: Since liquidity zones represent intense buy or sell interest areas, prices often gravitate towards these regions to “fill” the orders.
- Support and Resistance: Liquidity zones can act as dynamic support and resistance areas. A zone with significant buy orders might act as support, while one with sell orders might act as resistance.
The 30-day high and low prices are often seen as pivotal levels in trading primarily because they represent the recent extremes in valuation. Such extremes naturally become focal points for traders and investors, creating psychological benchmarks that many market participants watch closely. When you think of these levels, consider them as lines in the sand that many traders don’t want to see crossed. They denote zones that, if breached, might signal a changing tide in the market’s sentiment toward a particular asset.
See an example of what happens when the price breaks 30 days of resistance:

One of the main reasons these price levels are associated with high liquidity is the concentration of trading orders around them. Traders often set stop-loss orders near these levels to either protect their positions or take profits. As the asset’s price inches closer to these points, there’s an uptick in trading activity. This phenomenon can be attributed to the fact that these are the levels where traders, both institutional and retail, decide whether to cut their losses or lock in their profits.
Furthermore, institutional investors often come into play around these levels. With their substantial trading volumes, large institutions have strategies that revolve around buying assets at perceived support levels or selling at resistance. Since the 30-day high and low act as natural resistance and support levels, they are frequently zones where big players make their moves.
Another exciting aspect is that these levels serve as a reevaluation point for many. Say, for instance, a stock approaches its 30-day low. This could be perceived as a sign that the stock is entering a downtrend, potentially triggering increased selling. On the flip side, if a stock is nearing its 30-day high, it might draw more buyers in, interpreting it as an asset breaking out.
The anticipation alone of significant trading activity around these levels can increase volume, creating a feedback loop. It inherently becomes significant if everyone expects a level to be essential and acts based on that assumption. The result? More trading and, by extension, more liquidity.
Lastly, when the price reaches these levels, the outcome can further dictate market sentiment. If the asset’s price fails to push through its 30-day high or low and reverses direction, it validates that level’s strength. Conversely, if the price breaks and holds beyond these levels, it could signal the beginning of a new trend, prompting traders to reposition themselves.
How to Identify Liquidity Zones
Identifying liquidity zones is crucial for traders because these zones can significantly impact price movement and trade execution. Liquidity zones are areas on a chart with a high concentration of buying or selling interest, which can lead to higher trading volume and potentially act as support or resistance levels.
Here’s a detailed approach to identifying liquidity zones:
- Understand the Concept: Before identifying liquidity zones, one should understand that these zones represent areas where many traders have shown interest in buying or selling an asset, often due to historical price reactions at those levels.
- Historical Price Data: Start by looking at a chart of the asset you’re interested in. Historical price data, especially on daily or weekly timeframes, can help you identify areas where price has reacted strongly in the past. These could be areas where the price has reversed or consolidated.
- Volume Profile: Tools like the volume profile, which shows the amount of trading activity at various price levels, can be invaluable. High-volume nodes (areas where many volumes have traded) can often represent liquidity zones. This is because traders have shown a lot of interest in trading at those levels in the past, indicating potential future interest.
- Support and Resistance: Traditional and resistance levels can also act as liquidity zones. If a price level has historically acted as support (where the price tends to bounce), it might do so in the future because traders remember these levels and make buying decisions based on them. The same applies to resistance levels, where the price tends to drop.
- Psychological Levels: Round numbers, like $50 or $100 for stocks or 1.2000 for currency pairs, can act as liquidity zones. These levels are easy to remember, and many traders place orders around them, increasing liquidity.
- Gaps: In assets like stocks, gaps (where the price jumps from one level to another without trading in between) can act as liquidity zones. This is because traders might anticipate the price to ‘fill the gap’ in the future, leading to trading interest at those levels.
- Fibonacci Levels: For those who believe in technical analysis, Fibonacci retracement and extension levels can act as liquidity zones. These are levels derived from the Fibonacci sequence; many traders watch and place orders around them.
- Order Flow and Depth of Market (DOM): For traders with access to order flow data or Depth of Market, areas with a high concentration of stop orders or limit orders can act as liquidity zones. This is direct evidence of where traders are placing their orders.
- Observe Reaction: Once you’ve identified potential liquidity zones, observe how the price reacts when it approaches these zones in real-time. If the price shows hesitation, reversals, or increased volume, it further validates the importance of the zone.
- Re-assess Periodically: Like everything in trading, liquidity zones aren’t static. They can change based on new price information, news events, or changes in market structure. Regularly review and adjust your identified zones.
Volume Indicators and Liquidity zones
Volume indicators are essential tools in a trader’s arsenal, especially when analyzing liquidity zones. They provide insights into the trading activity and the strength behind price movements. Here’s a list of volume indicators that can help in analyzing liquidity zones:
- Volume Bars: This is the most basic form of volume representation. On most charts, volume bars are displayed at the bottom, representing the number of shares or contracts traded for a particular time frame. Higher bars mean more trading activity, often indicative of significant interest at a particular price level.
- On-Balance Volume (OBV): OBV is a cumulative volume measure that adds volume on up days and subtracts volume on down days. It gives traders an idea of the buying and selling pressure. When the OBV rises, it indicates that volume on up days is outpacing volume on down days, suggesting potential bullish interest.
- Volume Profile: This tool shows the volume traded at specific price levels rather than at specific times. It can highlight areas where much trading activity has occurred, suggesting significant support or resistance and potential liquidity zones.
- Volume Weighted Average Price (VWAP): VWAP is the average price a security has traded throughout the day, weighted by volume. Institutional traders use it to gauge the market trend and determine good entry and exit points. Prices above the VWAP may indicate an upward trend, while prices below may suggest a downward trend. The VWAP can act as a liquidity zone since many institutional orders revolve around it.
- Money Flow Index (MFI): The MFI is a volume-weighted version of the Relative Strength Index (RSI). It considers both price and volume to measure buying and selling pressure. A high MFI (above 80) might suggest an asset is overbought, while a low MFI (below 20) might indicate oversold.
- Chaikin Money Flow (CMF): This indicator measures the amount of Money Flow Volume over a specific period. A positive CMF indicates that the closing price is often near the high of the trading range, which can be interpreted as buying strength, while a negative CMF indicates the opposite.
- Accumulation/Distribution Line: This is another volume-based indicator that helps to measure the underlying flow of funds for security. It considers whether an asset is accumulated (bought) or distributed (sold). When this line rises, the asset is under accumulation, while a falling line suggests distribution.
- Price-Volume Trend (PVT): PVT is somewhat similar to OBV but considers the percentage increase or decrease in price to determine the amount to add or subtract from the cumulative total.
- Klinger Volume Oscillator (KVO): The KVO considers volume and price to determine the price trend. It does this by comparing the difference between two volume-weighted moving averages.
When analyzing liquidity zones using volume indicators, combining multiple indicators is beneficial for a more holistic view. Furthermore, it’s essential to understand the specifics of each indicator and what it represents in the broader market structure and sentiment context. Remember, while volume is a critical component of liquidity analysis, it’s just one piece of the puzzle.
Challenges and Limitations
While liquidity zones are invaluable tools, they aren’t infallible:
- False Signals: Just because there’s a liquidity zone doesn’t guarantee the price will reach or react to it.
- Changing Market Dynamics: Liquidity can shift, especially during news events or market uncertainty.
- Requires Context: Liquidity zones should be used with other analytical tools for a comprehensive trading strategy. For example, the fundamental analysis must also be an additional trigger for trading decisions.
Conclusion
Liquidity zones offer traders a deeper insight into the areas of price interest in the forex market. By understanding where significant buy or sell orders might exist, traders can better anticipate potential price movements, refine their strategies, and improve their trading outcomes. However, as with all tools and techniques in trading, understanding the context and combining multiple forms of analysis is critical to consistent success.

He is an expert in financial niche, long-term trading, and weekly technical levels.
The primary field of Igor's research is the application of machine learning in algorithmic trading.
Education: Computer Engineering and Ph.D. in machine learning.
Igor regularly publishes trading-related videos on the Fxigor Youtube channel.
To contact Igor write on:
igor@forex.in.rs
