Supply and demand zones in trading represent specific price areas on a chart where selling and buying activities have historically been concentrated. Supply zones indicate regions where sellers have consistently outnumbered buyers, causing prices to drop. Conversely, demand zones are areas where buyers have historically been dominant, leading to a price increase. These zones provide traders with insights into potential future price movements based on historical trading behaviors.
To draw this level is not easy.
I usually use the Supply and Demand indicator.


How to Draw Supply and Demand Zones?
You can manually draw supply and demand zones using the previous support and resistance price level as the main highest, and lowest lines. To draw the supply/demand zone area, you need to find the range of oscilation based on price fluctuation. However, you can instantly use Supply and Demand indicators to get important price levels on the chart.


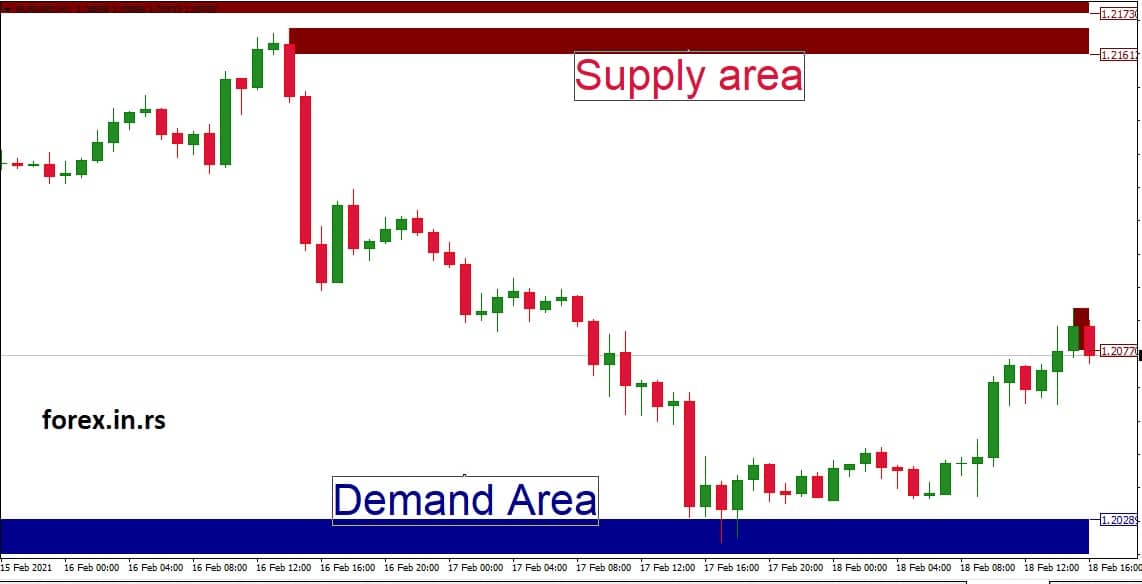
Supply and demand zones offer invaluable insights into potential price turnarounds or continuations in the market. Drawing them accurately can significantly enhance trading decisions. Here’s a detailed guide on how to identify and draw these zones:
1. Understand the Basics:
- Supply Zone: This is the price area on a chart where selling interest has historically overwhelmed buying interest, leading to a decline in price.
- Demand Zone: This area represents where buying interest has outstripped selling interest, causing the price to rise.
2. Identify Previous Support and Resistance Levels: Look for historical points where the price has changed direction.

- Support: A price level where a downtrend was halted due to increased buying interest.
- Resistance: A price level where a rally terminated due to increased selling pressure.
3. Look for Price Oscillation: After identifying support and resistance levels:
- Find areas where the price has oscillated between two levels multiple times without breaking out significantly. This repetitive fluctuation confirms the zone’s validity.
4. Drawing the Zones:
- For Demand Zones:
- Begin with the most recent support level, where the price reversed after a significant downward movement.
- Draw a horizontal line at this level (this is the lower line of your zone).
- Identify the highest point within the price fluctuation before the upward movement began and draw a second horizontal line here (this will be the upper line of your zone).
- For Supply Zones:
- Start with the most recent resistance level, where the price reversed following a noticeable upward movement.
- Draw a horizontal line at this point (this is the upper line of your zone).
- Determine the lowest point of the price fluctuation before the downturn began and draw another horizontal line here (this serves as the lower line of your zone).
5. Color-Coding and Labeling (Optional but Helpful):
- Shade the area between your two lines to denote the zone on your chart clearly. Using different colors for supply and demand zones can enhance clarity.
- Labeling the zones as “Supply” or “Demand” along with the date of formation can help in future analysis.
6. Use of Indicators: While manually drawing zones gives you a solid understanding and more control, employing specialized supply and demand indicators can speed up the process. These indicators are available on most trading platforms:
- Automatically highlight potential supply and demand zones based on preset criteria.
- Continuously update as new price data becomes available, ensuring you’re always aware of the most recent zones.
Conclusion
Drawing supply and demand zones requires a mix of historical data analysis and keen observation of price patterns. Whether done manually or with indicators, these zones provide a robust framework for anticipating future price movements and optimizing trading strategies.

He is an expert in financial niche, long-term trading, and weekly technical levels.
The primary field of Igor's research is the application of machine learning in algorithmic trading.
Education: Computer Engineering and Ph.D. in machine learning.
Igor regularly publishes trading-related videos on the Fxigor Youtube channel.
To contact Igor write on:
igor@forex.in.rs
