Table of Contents
The Standard & Poor’s 500, also known as the S&P500, is a stock market index considered one of the most important benchmarks for measuring the performance of the U.S. equity market. Initially launched in 1957 by Standard & Poor’s Financial Services LLC, the S&P500 comprises 500 of the largest companies in the United States listed on the New York Stock Exchange and the NASDAQ.
In recent articles, we covered European stock market open and close times, US market open and close, and Asian market open and close. Additionally, we presented S&P 500 trading hours, best forex sessions, when the forex market opens, and where the forex market closes on Friday. Finally, we explained when the stock market is open on Saturdays and when it is open on Sundays.


What is S&P 500?
The Standard & Poor’s 500 or S&P 500 or S&P or SPX represents a weighted stock market index comprising the 500 largest companies by market capitalization listed on the New York Stock Exchange (NYSE) Nasdaq. Founded in 1957, S&P 500 represents the strength of the US economy.


It is often used as an indicator of business cycles.
S&P 500 chart and current price
[stock_market_widget type=”chart” template=”basic” color=”#5679FF” assets=”^GSPC” range=”6mo” interval=”1d” axes=”true” cursor=”true” range_selector=”true” api=”yf”]
[stock_market_widget type=”inline” template=”generic” assets=”^GSPC” markup=”Currently S&P 500 is trading at {price} ({change_pct}). In the last 52 weeks, the lowest low was {52_week_low} and 52 week high was {52_week_high}” api=”yf”]

S&P 500 Trading Hours
SPx500 trading hours (S&P 500 market hours) are between 09:30 to 16:00 (EST) or 14:30-21:00 (GMT). However, if we count pre-market hours and after-market hours, you can trade SPx500 from 04:00 to 20:00 (EST). Additionally, CFD SPx500 you can trade all day from Monday morning to Friday night.
Please see the Table SPx500 trading hours:
| SPx500 Opening Hours | Opening Hours | Extended hours (pre-market & after-hours) |
|---|---|---|
| Eastern Time (EST) | 09:30 – 16:00 | 04:00 – 20:00 |
| Central Time (CST) | 08:30 – 15:00 | 03:00 – 19:00 |
| Mountain Time (MST) | 07:30 – 14:00 | 02:00 – 18:00 |
| Pacific Time (PST) | 06:30 – 13:00 | 01:00 – 17:00 |
| Greenwich Mean Time (GMT) | 14:30-21:00 | 06:00 - 23:00 |
The market hours for trading the SXP500 are set by the New York Stock Exchange (NYSE) and are from 9:30 AM to 4:00 PM Eastern Standard Time (EST) or 2:30 PM to 9:00 PM Greenwich Mean Time (GMT) on regular trading days. These hours are known as the regular market hours.
The reason for these specific hours is to allow for maximum liquidity and participation by traders and investors in the United States. The regular market hours overlap with the business hours of major financial institutions and market participants, making it easier for them to trade and transact in the market.
Pre-market trading hours for the SXP500 begin at 4:00 AM EST and end at 9:30 AM EST. During pre-market hours, traders can place orders for SXP500 stocks but may not execute immediately, as trading volumes are typically lower than during regular market hours. After-market trading hours for the SXP500 begin at 4:00 PM EST and end at 8:00 PM EST. Similar to pre-market hours, trading volumes are typically lower during after-market hours, and prices can be more volatile due to lower liquidity.
It’s important to note that pre-market and after-market trading hours can carry additional risks due to lower trading volumes and potential price volatility. Additionally, not all brokers offer pre-market and after-market trading options, and the trading rules and regulations may differ from those of regular market hours. Traders should understand the risks and limitations of pre-market and after-market trading before participating in these extended hours.
Once you know the operational market hours and the principles you should consider while making your strategy, the next and most crucial step is to create that profitable strategy. You can choose between fundamental and technical analysis as your basis for creating a good trading strategy. Many experienced traders factor in both while devising their strategies.
S&P 500 closed the market during the Holidays
Non-working days in 2023 when you can not trade S&P500 in the US are:
- New Year’s Day: January 2.2023 (Monday — observed)*
- Martin Luther King Jr. Day: January 16.2023 (Monday)
- Presidents’ Day: February 20.2023 (Monday)
- Good Friday: April 7.2023 (Friday)
- Memorial Day: May 29.2023 (Monday)
- Juneteenth National Independence Day: June 19.2023 (Monday)
- Independence Day: July 4.2023 (Tuesday)
- Labor Day: September 4.2023 (Monday)
- Thanksgiving Day: November 23.2023 (Thursday)
- Christmas Day: December 25.2023 (Monday)
CFD SPx500 trading hours
CFD SPx500, traders can trade almost 24 hours a day, five days a week, from Sunday to Friday. In addition, CFD brokers offer forex, indices, commodities, and futures for trading.
Brokers such as HFM or IC Markets offer indices similar to forex that you can trade the whole trading day. See the example of market trading hours:
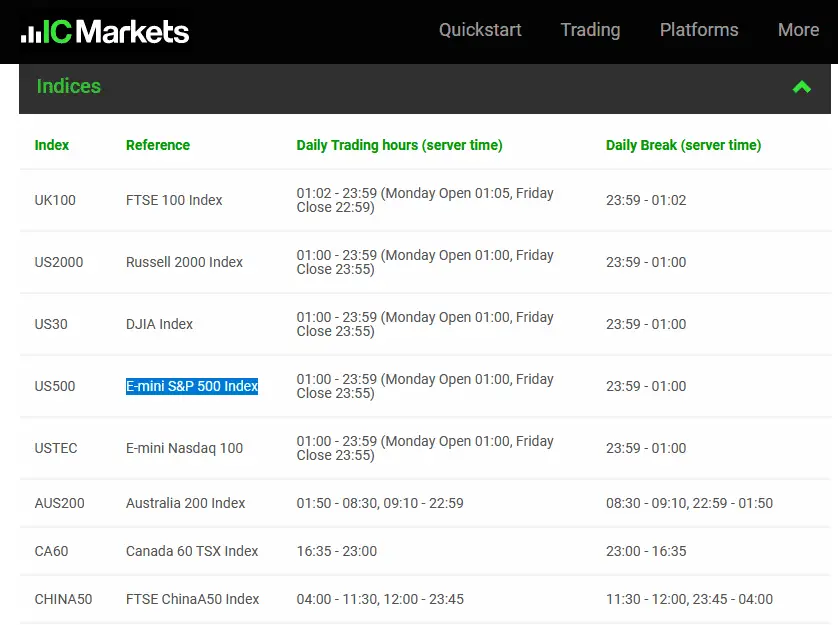
To trade SXP500 from Monday to Friday whole day visit HFM:
How to Trade S&P 500?
To trade S&P 500, please follow these practical rules:
- Before entering any trade, analyze the current market and define the take-profit and stop-loss prices before investing.
- Be careful to enter into trades during the recession and high US inflation.
- Short-time predictions for indices have low accuracy, and trading an S&P 500-day trader is hard.
- Avoid long-term buy investments for S&P 500 if Shiller PE Ratio or price-earnings ratio, based on average inflation-adjusted earnings from the previous 10 years, is too high.
- You should limit your exposure and manage your risk. For example, it is advised not to let your exposure rise more than 5%.
- Never trade without stop-loss!
- Keep your emotions aside while trading.
- Economic data is known to stir the market and create volatility. So keep your head in the game whenever high-impact data is released.
- Keep a record of your trades. Journal all your trades. It will make you more confident, and you will analyze your trades in a better light. Review this journal weekly to determine how your decisions impact your profit and losses.
Can you day trade the S&P 500?
Yes, many corporations, prop companies, and retail traders trade S&P 500 using day trading strategies. Usually, they open trades after the opening range (30 minutes or 1 hour after markets open) and enter into trades based on technical analysis patterns and fundamental research. However, most traders keep trades for at least a few days or, in the long term, several weeks or months because of better trading accuracy.
Some trades traders trade S&P 500 gaps and various day trading strategies too.

He is an expert in financial niche, long-term trading, and weekly technical levels.
The primary field of Igor's research is the application of machine learning in algorithmic trading.
Education: Computer Engineering and Ph.D. in machine learning.
Igor regularly publishes trading-related videos on the Fxigor Youtube channel.
To contact Igor write on:
igor@forex.in.rs
