Liquidity, as a term in financial markets, represents the ease with which an asset or security can be bought or sold without causing a substantial impact on its price. An asset with high liquidity allows significant transactions to occur without a dramatic price shift, fostering an environment of relative price stability. Conversely, an asset with low liquidity tends to demonstrate price vulnerability, resulting in higher price volatility, which can affect trading strategies and decisions.
Price spikes embody sudden and drastic shifts in an asset’s price, often driven by various catalysts, including unexpected news, economic events, or alterations in liquidity. Particularly in low liquidity conditions, an asset can experience pronounced price spikes as a significant transaction might disrupt the balance of supply and demand, resulting in rapid price changes.
What is a Liquidity Grab in Trading?
Liquidity Grab represents the sharp price movement of the currency pair caused by the large volume of orders, usually during important news or session openings. This imbalance between supply and demand can lead to a sharp rise or downtrend in price, creating what is often seen on a chart as a long/short momentum candle.


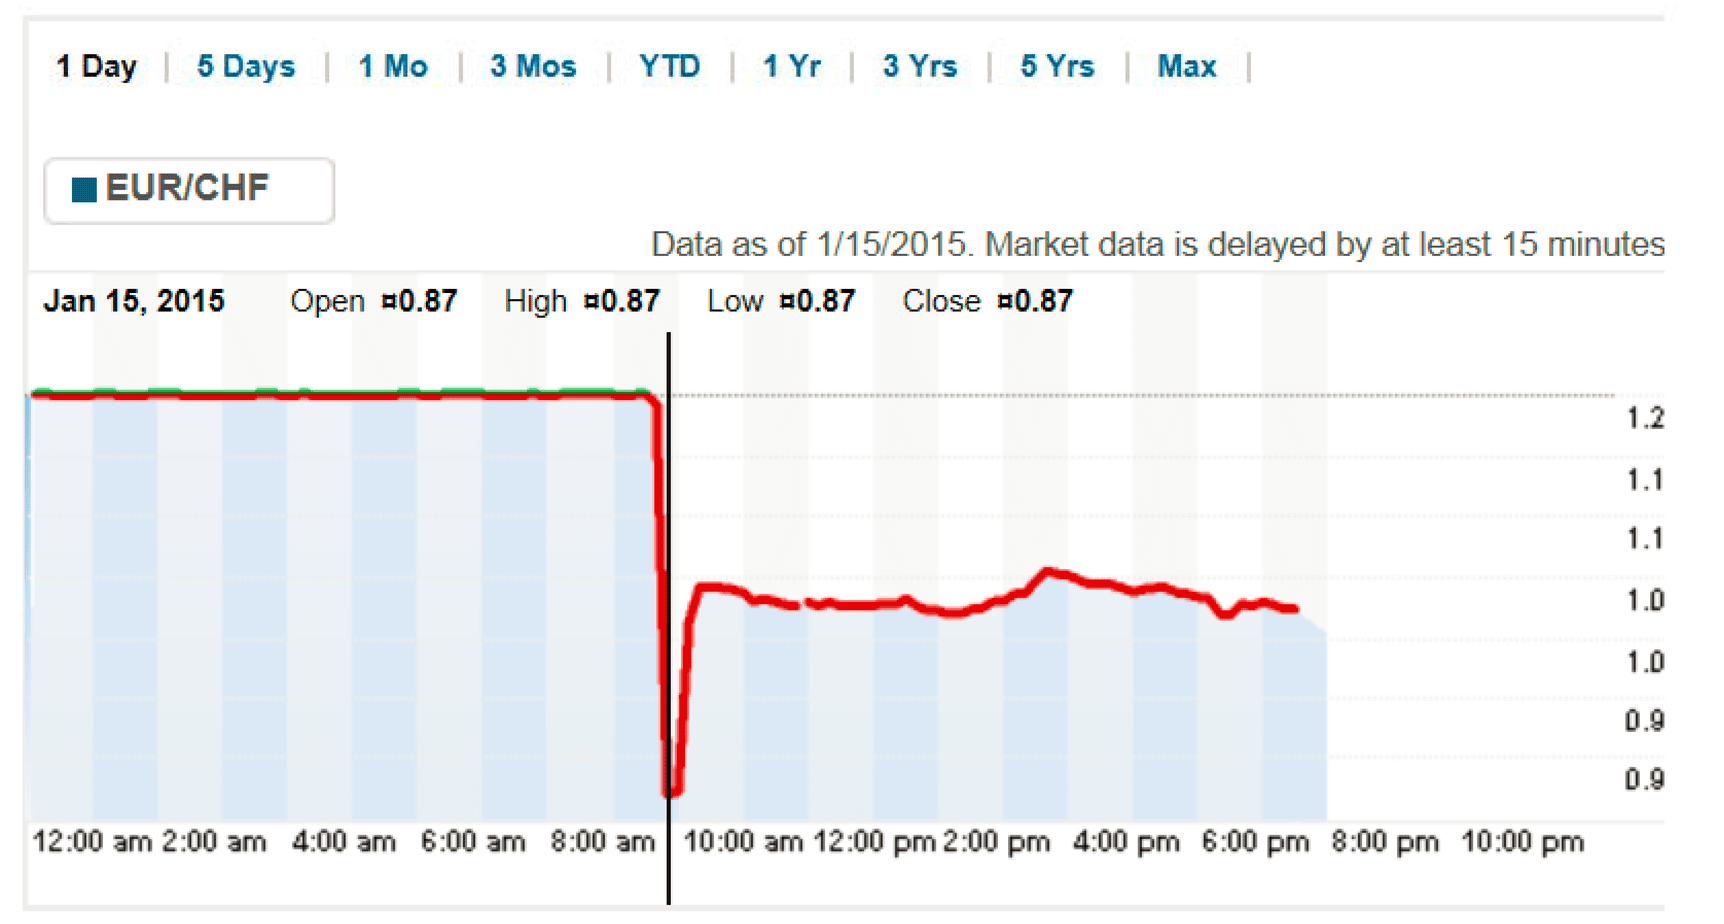


Above is an example of the enormous liquidity grab of CHF in January 2015, one of the most significant forex moves ever.
See my youtube video that I created for Liquidity grab explanation:
“Liquidity grab” is a term often used in trading, including the foreign exchange (forex) market, to describe a phenomenon where a large volume of orders suddenly floods the market, leading to a sharp movement in the price of a specific currency pair. Here’s a more detailed explanation:

- Understanding Liquidity: In financial markets, “liquidity” refers to the ease with which a financial instrument (like a currency pair in the forex market) can be bought or sold without causing a significant change in its price. High liquidity means many buy and sell orders at any given time, making it easy to enter or exit trades without dramatically affecting the price. Conversely, low liquidity suggests fewer orders in the market, which can lead to more price volatility when large orders are placed.
- Market Orders and Liquidity Pools: Liquidity grabs often happen around so-called “liquidity pools,” which are price levels with many pending orders (either stop or limit orders). These orders can come from traders who’ve set stop-loss, take-profit points, or institutional traders looking to enter or exit prominent positions.
- The Mechanics of a Liquidity Grab: Here’s what typically happens during a liquidity grab:
- A sudden surge of market orders in a specific direction (buy or sell) hits the market. This surge could be due to a news event, a change in economic indicators, or even large institutional orders.
- If this surge is significant enough, it can ‘consume’ all the available liquidity at the current price levels, causing the price to move towards levels where more liquidity (in the form of pending orders) is available. This is the ‘liquidity grab.’
- Once the price hits these liquidity pools, many orders there get filled, adding to the momentum of the price movement. This can cause a sharp, sudden move in price, even if the original surge of orders wasn’t massive.
- Implications for Traders: For traders, liquidity grabs can be both a risk and an opportunity. On the one hand, the sudden and sharp price movement can lead to slippage (where trades are executed at a worse price than expected) or trigger stop-loss orders, potentially leading to losses. On the other hand, traders can accurately predict a liquidity grab; they can profit from the sharp price movement.
While the “liquidity grab” concept is often discussed among traders, it’s not a formally defined term in financial theory. Its interpretation can vary, and the actual dynamics of the market are complex and influenced by a wide range of factors.
The institutional investor places a significant buy order, and the immediate supply in the market may not be enough to satisfy this demand. This imbalance between supply and demand can lead to a sharp rise in price, creating what is often seen on a chart as a long momentum candle.
The price moves up not only because of the large buy order but also due to the market’s reaction to this order. Seeing the price rise, other market participants might believe that the price will continue to rise and place buy orders of their own, adding to the demand and pushing the price even higher.
At the same time, the market is constantly in search of liquidity. In this context, liquidity refers to the availability of sell orders that can satisfy the buy orders in the market. When a large buy order is placed, the market may have to ‘search’ for this liquidity by moving to price levels where more sell orders exist.
Eventually, as the price reaches these higher levels, more sellers might be attracted to sell their shares at this higher price. This increase in supply can help to satisfy the demand and, thus, rebalance the market.
After the large order is fully executed and if no more large buy orders come in, the price might fall as the market ‘rebounds’ from this temporary imbalance. The price could return to a ‘fair value,’ balancing supply and demand.

He is an expert in financial niche, long-term trading, and weekly technical levels.
The primary field of Igor's research is the application of machine learning in algorithmic trading.
Education: Computer Engineering and Ph.D. in machine learning.
Igor regularly publishes trading-related videos on the Fxigor Youtube channel.
To contact Igor write on:
igor@forex.in.rs
Related posts:
- How to Find Liquidity in Forex? – Find Liquidity Zones in Chart
- What is Liquidity Zone in Forex?
- Best Liquidity Forex Indicator for MT4 and MT5!
- How I Use The Dollar Index (DXY) To Increase Trading Profits? – Useful Live DXY Trading Example!
- How to Start Day Trading?
- How to Use AI in Forex Trading?
- What is CFD Trading and How Does it Work?
- How to Set Profit Target in Trading?
- Forex AI Concept in Trading
- Why Trading Forex is so Difficult?
- How to Open LLC for Forex Trading?
- The 5 Lots in Forex Trading!
