Table of Contents
Some traders trade several times per day, some few times per week, while some institutional traders keep their trading positions for several months or years. Therefore, many trading styles and preferences are based on your available time, personality, and strategy.
Today, we will analyze swing trading.


Let us first see the swing trading definition:


What is swing trading?
Swing trading is a trading technique that attempts to capture gains in any financial instrument over a few days (more than 1 day) to several weeks. Swing traders primarily work on four-hour (H4) and daily (D1) charts, and they may use a combination of fundamental analysis and technical analysis to guide their decisions.
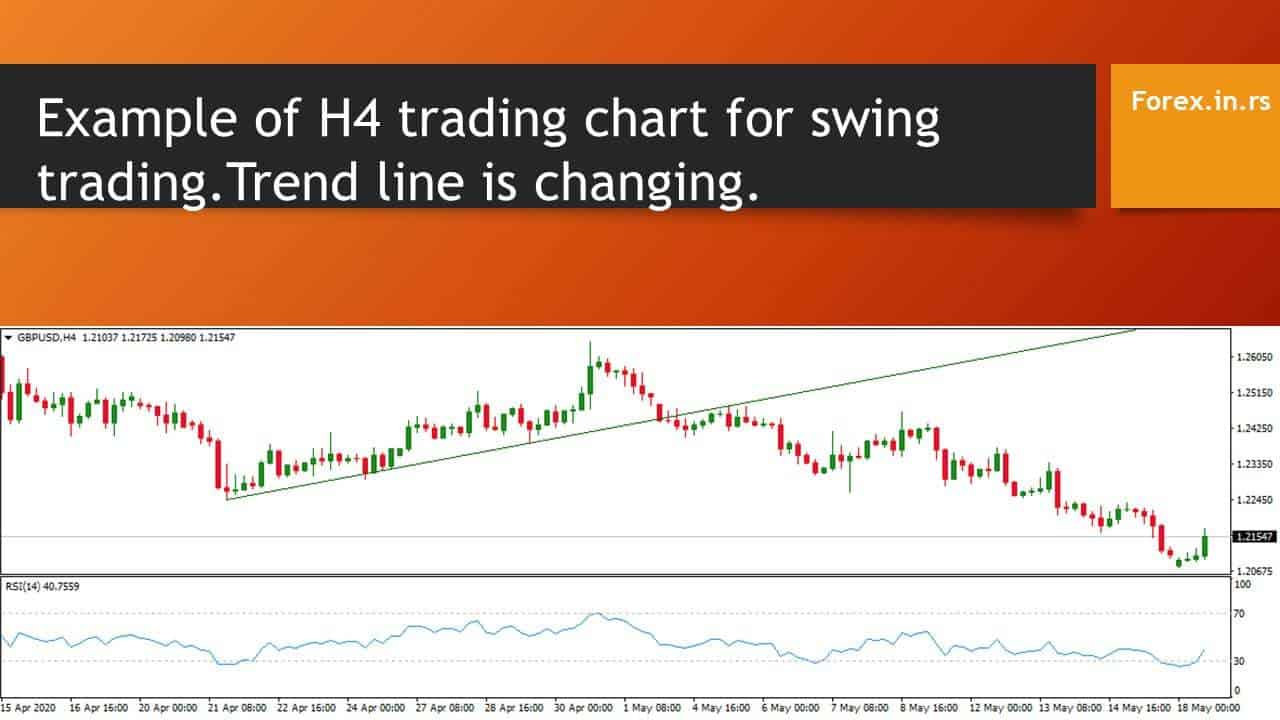
What Is The Best Time Frame for Swing Trading?
The best time frame for swing trading is the four hours (H4) time frame. However, sometimes swing traders use weekly and daily time frame charts in low or high-volatility markets. Market volatility and instrument type dictate the trading time frame for swing traders.
Below is the presented EURJPY H4 chart where the trader created a swing sell order after 3 weeks of support was broken:

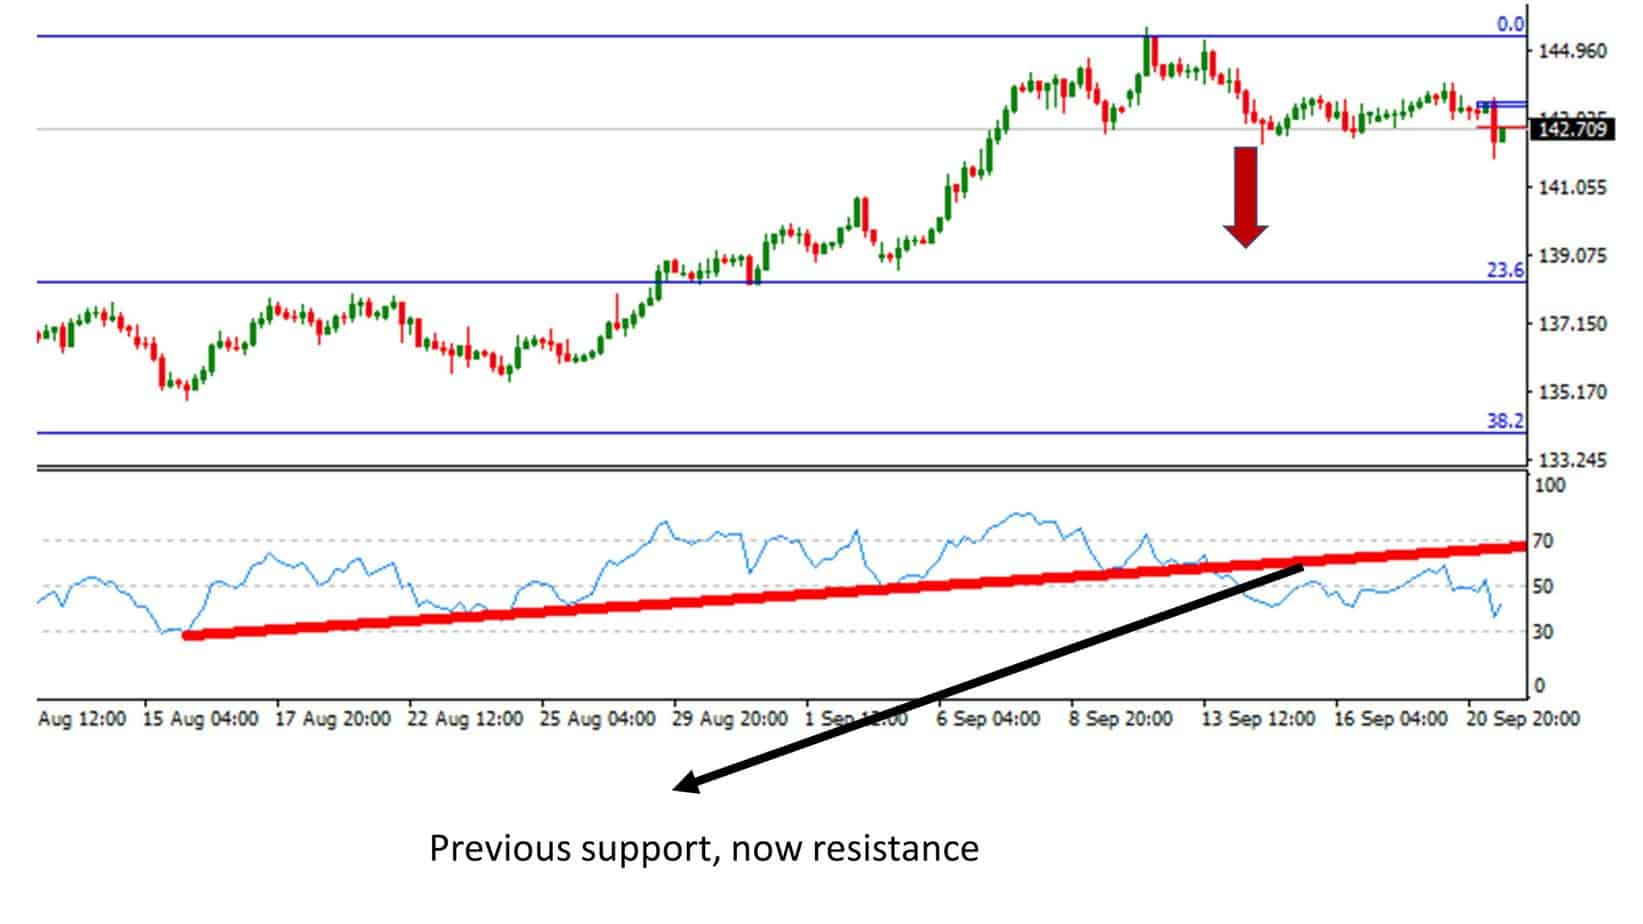
Swing trading is typically the best option for beginner traders to get started. The main reason for that is a small number of trades per month for swing traders, unlike day traders. Swing trading can prevent the overtrading problem. Swing trade routine needs to be based on analysis of significant price levels and avoiding overtrading.
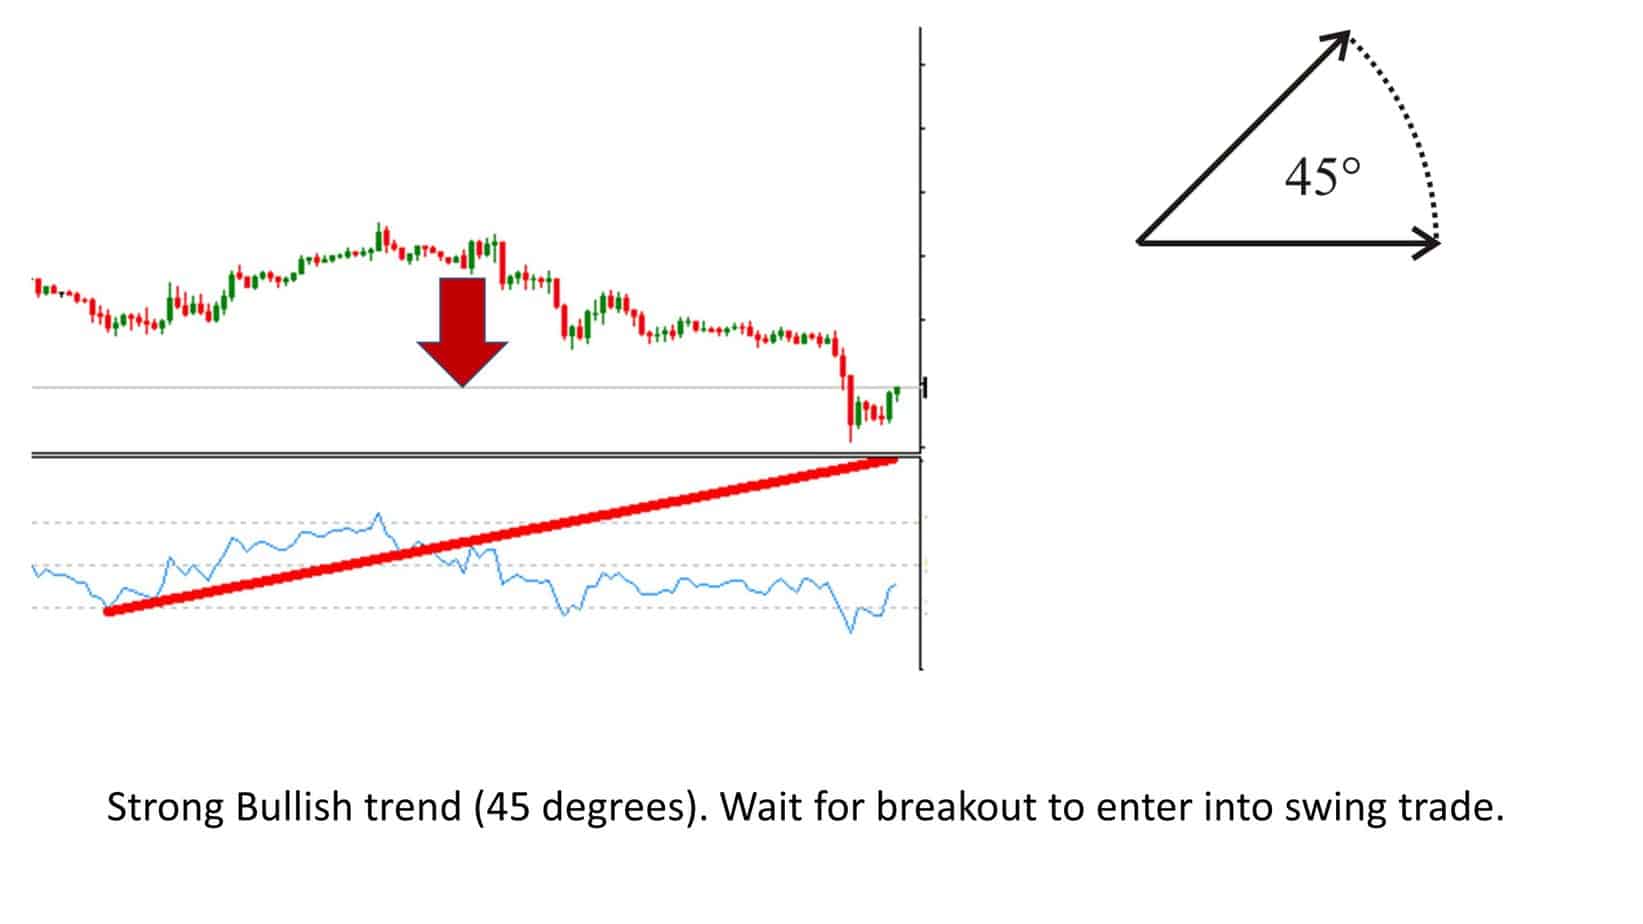
How to choose the best swing time-frame chart?
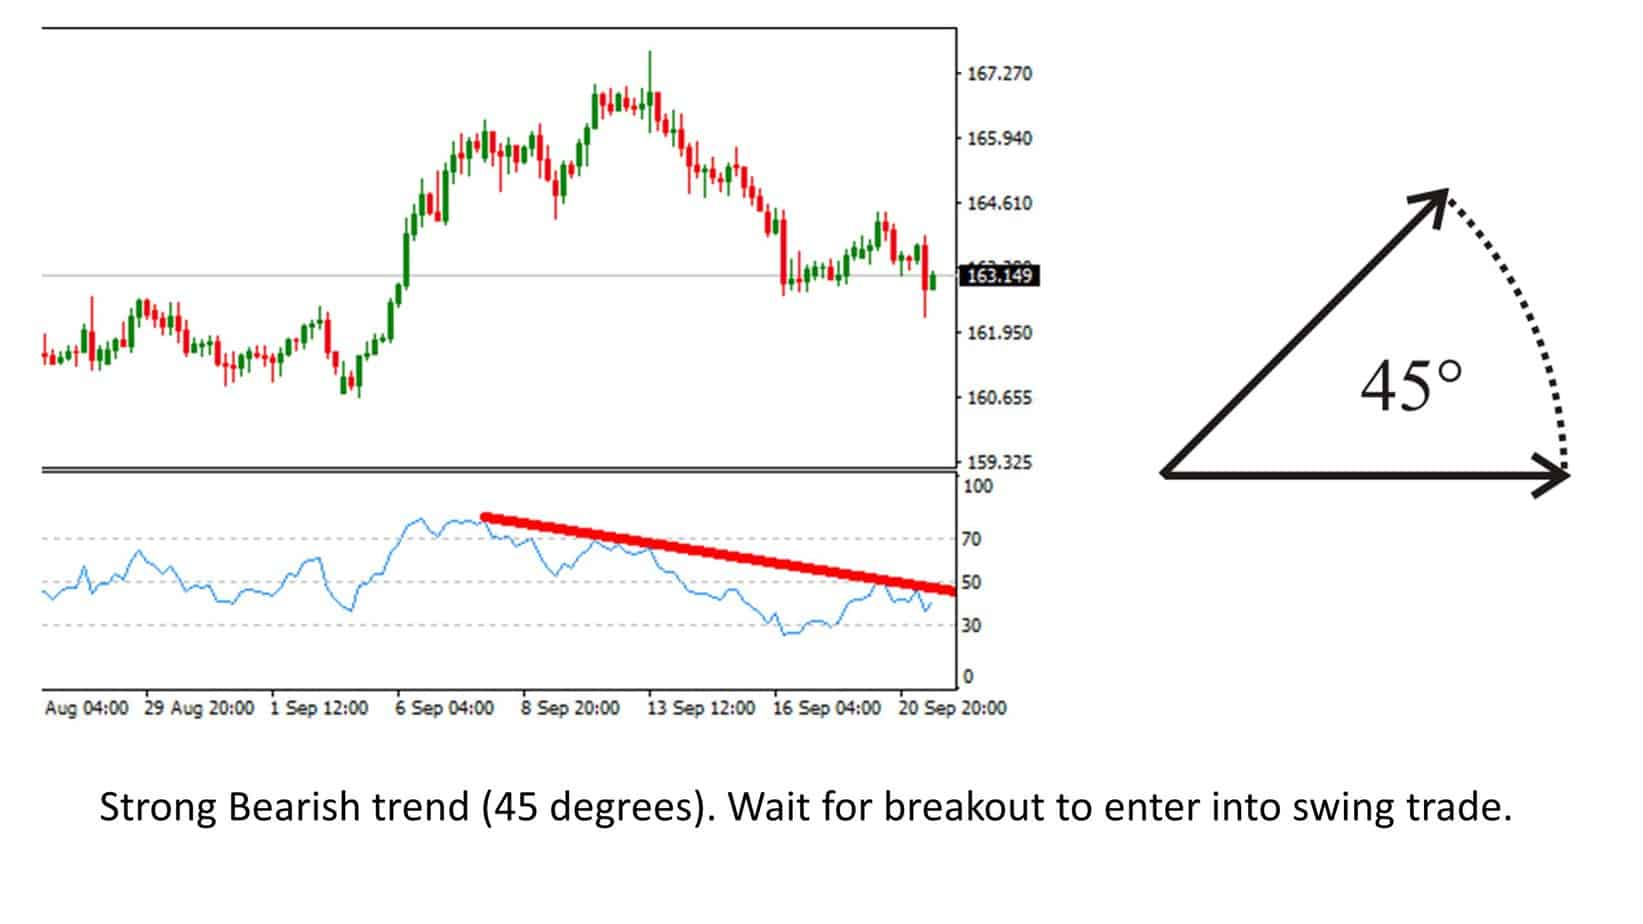
Draw trend lines on the RSI indicator to choose the best swing trade time frame. If you see 45 degrees RSI indicator, that means that trend is strong and that the time frame is ideal for a breakout swing trading strategy.
See examples below:
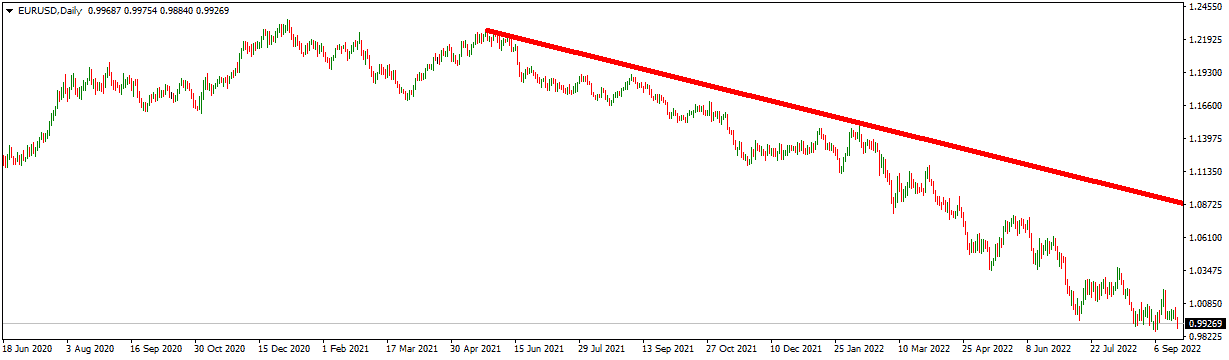
Let us see a bearish example:
Typically, the most used time frame is the four-hour (H4) chart time frame, then a daily chart frame. It is possible to succeed in forex trading using a different time frame, but these two are the most common. Sometimes, the time-frame type depends on the financial instrument. Equities or ETF trading is not as exact as forex trading.
Swing trading ETFs strategies show the best performance on the Daily chart time frame because bullish trends are longer for ETFS baskets such as stocks, bonds, and commodities.
Swing trading and 1-hour chart
In trading, a 1-hour chart is one of the most used chart time frames. Swing trading 1-chart strategies sometimes can use hourly candle close price to enter into position or exit from the trades. The reason for that is market volatility, and price action that very often reaches some price level goes over or under the price and then reverses in the opposite direction. For example, the price oscillates below level 1.300. Traders have a stop loss at 1.3 and try to sell the position. In one moment, the price goes above 1.300 and after a few minutes goes down 50 pips. Traders who close the trade by stop-loss made a loss; traders who waited for an hourly candle to close above the stop level made a profit. This term trading is known in trading slang as “wash up.”
Swing traders can use an hourly chart time frame, but they will usually watch the Daily chart because they need to be sure that they can keep their position for at least a couple of days, and they need to follow the overall trend.
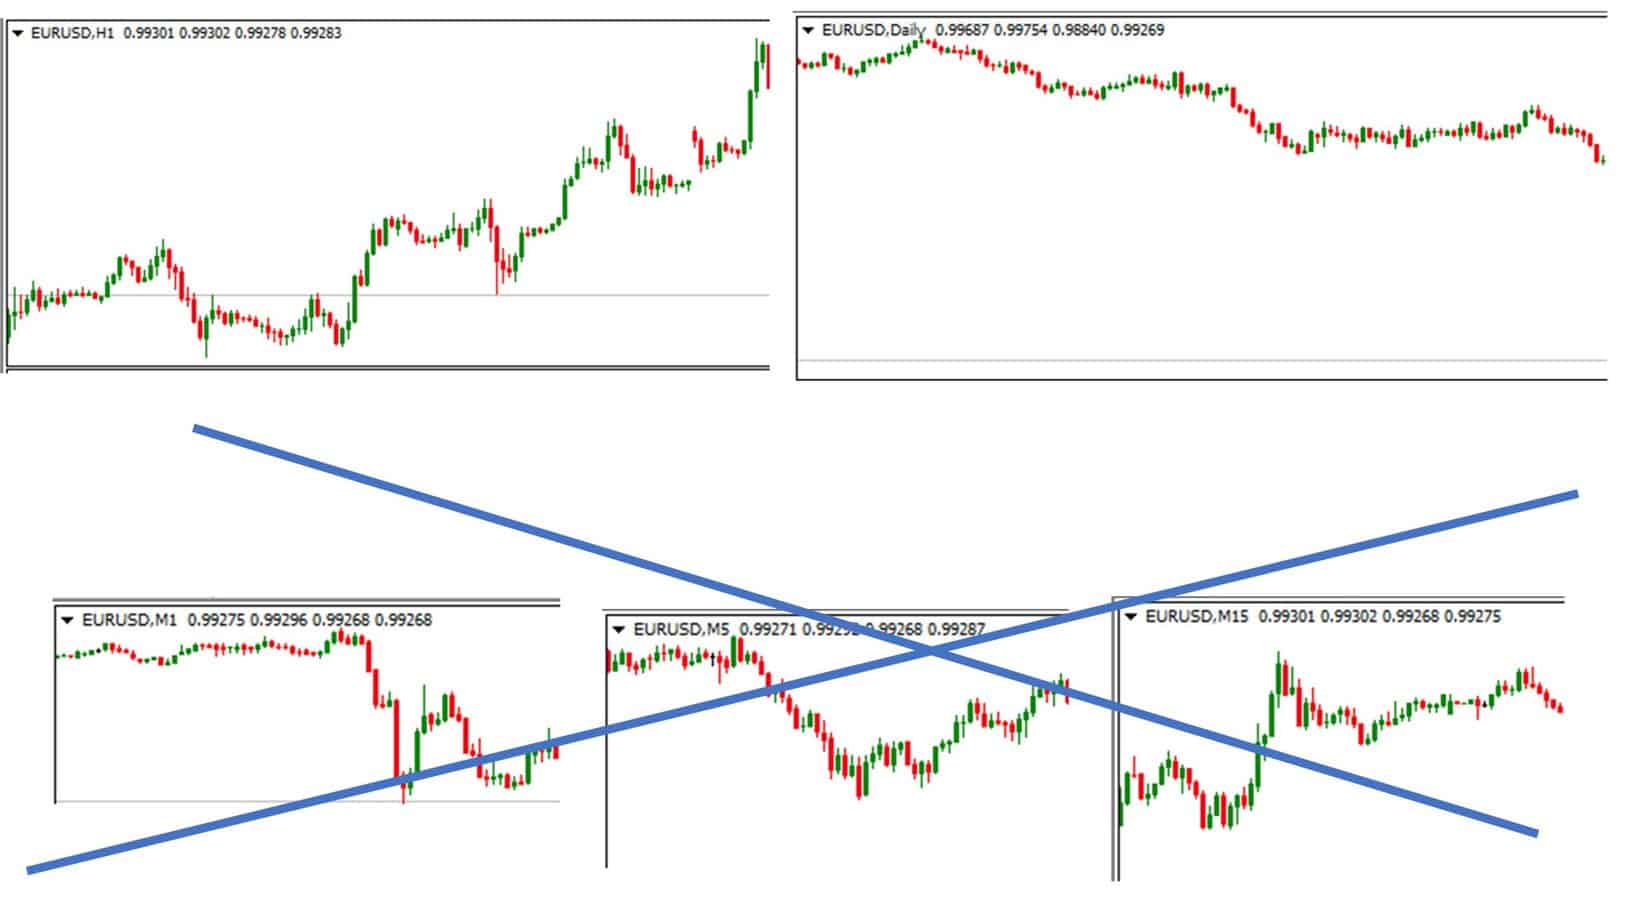
Minute bars are another time frame that some traders choose to use. Minute bars are used far less frequently than the daily time frame chart. This means that minute bars are much less significant than daily bar charts and, therefore, less reliable when trading swing trades.
Minute, 5 minutes, 15 minutes, 30 minutes, and hourly chart swing traders never use alone without daily, weekly chart because they need to be sure what is the overall trend.
Swing trading example
Now let’s go over an example swing trade. Most swing traders will use the daily chart to determine the general market direction. They may then choose to use the 4-hour chart for entering positions.
If you see a range market on the H4 chart, you can use the Daily chart for swing trading if there is no volatility.
The 4 hours time-frame advantages
On 4 hour chart, some momentum indicators represent excellent market conditions. For example, the 4H RSI indicator can show the best trend change or divergence.
In high volatility periods, sometimes it is better to enter into trade faster than to wait the whole day to enter after the Daily chart closes.
The Daily time frame advantages
Daily bars are, in most cases, the most effective interval aimed at swing trading. Even while swing trading may be done on other timescales, the day-to-day interval is where most traders should focus their attention since it offers several benefits that mark it an excellent choice for practically every dealer.
The biggest daily chart time frame advantage for swing traders is the ability to catch multi-week trading positions and achieve highly profitable trades. Sometimes, swing trades can become position trades after a couple of months.
In the given post, we will discuss why we believe you must choose the regular period and what benefits you will obtain from not using swing trading with minute bars.
The daily time frame is recommended to formulate trading strategies because of its more significant value. More significantly, you may be sure that the things you find will be helpful in business situations that take place in the actual world. It will also be less challenging to discover potentially fruitful approaches and edges with an average transaction size large enough to pay trading charges such as slippage and fees.
A low average trade might significantly challenge trading strategies that rely on minute data. This is because many things you find would be too weak to leave much of a profit after accounting for slippage and fees.
The daily time frame has unique advantages, making it the best option for most traders.
The daily bar time frame is the most common bar setting, and due to this, it is not seen as the most exciting time frame for trading. I would say that the daily time frame is still the smartest choice if you are a new trader. The daily time frame has multiple advantages, such as;
Even with this flexibility, some charts are used more frequently than others. This is true for the daily time frame. The daily time frame is used most by traders, large entities, and mutual funds. These big players have a pretty significant impact on the market and price fluctuation.
So what does all of this mean? It means that most eyes are on the daily time frame charts. This means that many people are analyzing them and are ready to take action at the sight of a buying opportunity.
Multiple time frame swing trading
In swing trading, professional traders use multiple time frames. For example, they use the H4 chart to analyze market conditions but often analyze higher time frames to better understand price action or the last several weeks’ trends. Of course, some traders execute positions looking at m30 or m5 time frames because they try to enter a position at the right moment (they look for every single pip gain).
Swing trades probability
High-probability swing trading strategies are based on significant price levels. Essential price levels on the Daily chart that show strong resistance or substantial support increase trade probability. For example, ten days of strong support has a more significant impact and bigger trading probability than 2 days of the support price level. However, traders need to know that the likelihood for risk-reward 1:1 trades is just a few percent above 50% because the market is tough to predict, even using the best machine learning methods or any quantitative approach.
The best indicators for swing trading
The best swing trading indicators are based on important price levels such as trendlines, Fibonacci, and Pivot point. However, engulfing patterns and doji candlesticks with a combination of important price levels can be excellent swing trading indicators to determine entry positions for swing traders.
Other excellent swing indicators are MACD and RSI indicators. The best MACD settings for swing trading are default settings MACD parameters EMA 12, EMA 26, and EMA 9. The best approach is to draw trendlines on MACD and RSI indicators and wait for a breakout as an additional trigger for the swing trading position.
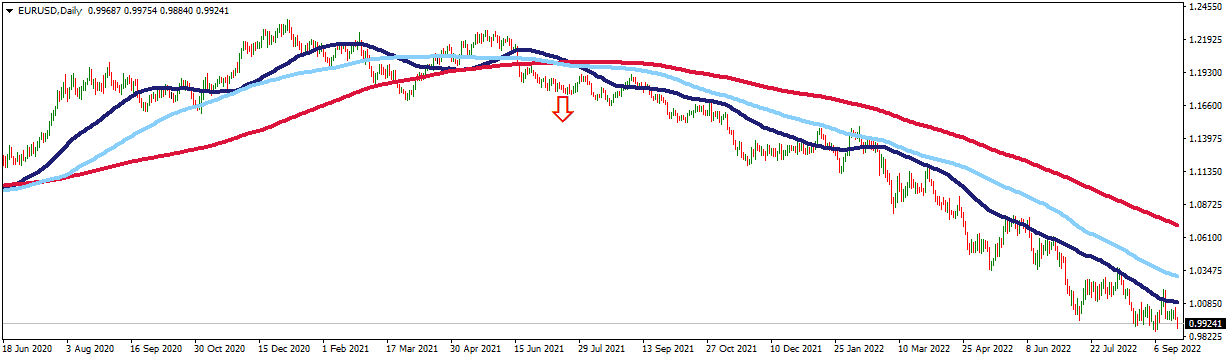
The best moving averages for swing trading are MA 50, MA100, and MA 200 on the daily chart frame. Most professional traders use it as a signal, especially SMA 200 or EMA 200. EMA200 represents the best EMA or exponential moving average signal in swing and long-term trading.
Of course, swing trading with Ichimoku uses a similar approach where The Tenkan and Kijun Sens lines are used as a moving average on H4 and Daily chart.
As a swing trader, you will be holding your positions overnight, not buying and selling on the same day. Since you are swing trading, it is best not to watch charts all day long.
In most cases, trading strategies will enter on the open or close of a bar. Due to this, you will want to use relatively long bars instead of watching the open and close of every 5 or 10-minute bar.
When choosing and dating a trading strategy, it is crucial to ensure that it is not solely based on random past market data. This will ensure that you have the best chance of success in trading the markets.
It is pretty accurate to say that the randomness of the market increases as you shorten your time-frame. Therefore, using the daily time-frame is the best option as it will allow you to see proper market behavior.
This will help you be more confident that the things you find will work for living trading. It will also be much easier to find strategies with potential and average trade sizes large enough to offset trading costs like commissions.
Trading strategies that rely on minute bar data and have a low average trade could often become an issue. Most good trades would be too weak and likely not have anything left after commissions.
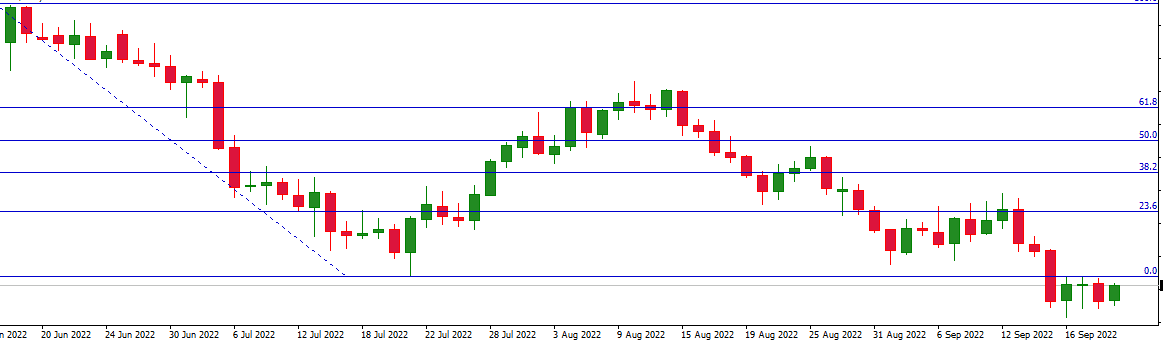
Swing trading cryptocurrency
In the last decade, traders traded cryptocurrencies and used swing trading. The best swing trading cryptocurrency strategy is to wait for the pullback below 23.6% FIb level (sometimes up to 38.2 Fib. level ) on the H4 time frame (or Daily time frame) and then enter into trade. Usually, crypto traders want to catch the strong bullish trend, and the best approach is to buy after a correction.
The pullback can go to 23.6%, or 38.2%, or 50%, and at most 61.8%. In the image below, we can see bearish crypto swing trade from June, then pullback up to the middle of August (61.8%), and then a bearish trend again:
Curve fitting and swing trading
Curve fitting optimization aims to find an optimal set of parameters for a defined function that best fits a given set of observations. In swing trading, overfitting models do not provide a wished performance. However, swing trading models can have solid performance for daily and weekly chart-frame because traders do not overtrade in that time frame.
Trading with a model that has been changed based on previous data rather than on the actual activity of the marketplace is known as backtesting. To put it another way, backtesting is the practice of trading. This is a significant distinction given that practically all market data is random and cannot be used to anticipate future price changes in the market accurately.
If we want our trading techniques to have any chance of success, we need to make judgments based on non-random segments of market data. Furthermore, as market unpredictability grows with decreasing period resolution, daily bars improve the likelihood of witnessing genuine market activity worth acting upon.
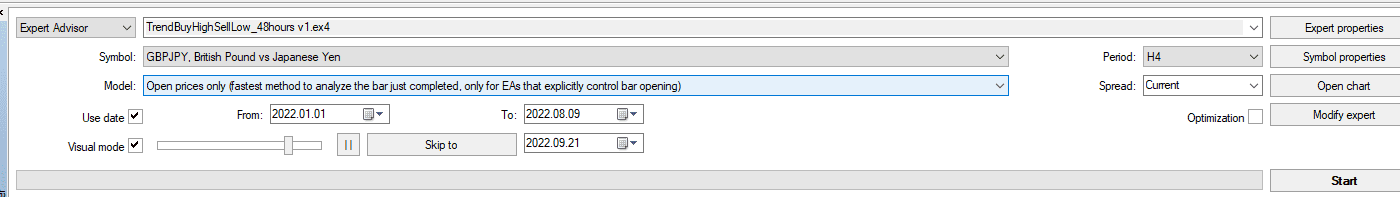
If you create an expert advisor for swing trading daily chart time frame, you will have less than 30 positions during the year. Therefore, you will have less number of trades, a smaller commission, and a better risk-reward ratio which can improve your profitability.
Swing trading has less trading frequency.
The overnight holding period means swing traders don’t need to monitor their accounts constantly. And since most trading strategies either go for open or close of a bar, you’ll want to choose a relatively significant period, so you aren’t constantly checking the 5-minute bars.
For this reason, regular bars are ideal; not only do they open and close every day, but patrons who come in at the start of the night have the rest of the night-time to order their drinks and food. The time you decide to make trades is thus quite malleable. To participate in swing trading, you only need a few hours between the market’s closure and opening each day. This makes it far more feasible to work a round-the-clock profession besides your primary occupation.
If you do not have time, no more than 20 minutes per day is needed to engage in swing trading, while in day trading, you need to monitor the market much often and be a “nimble trader.”
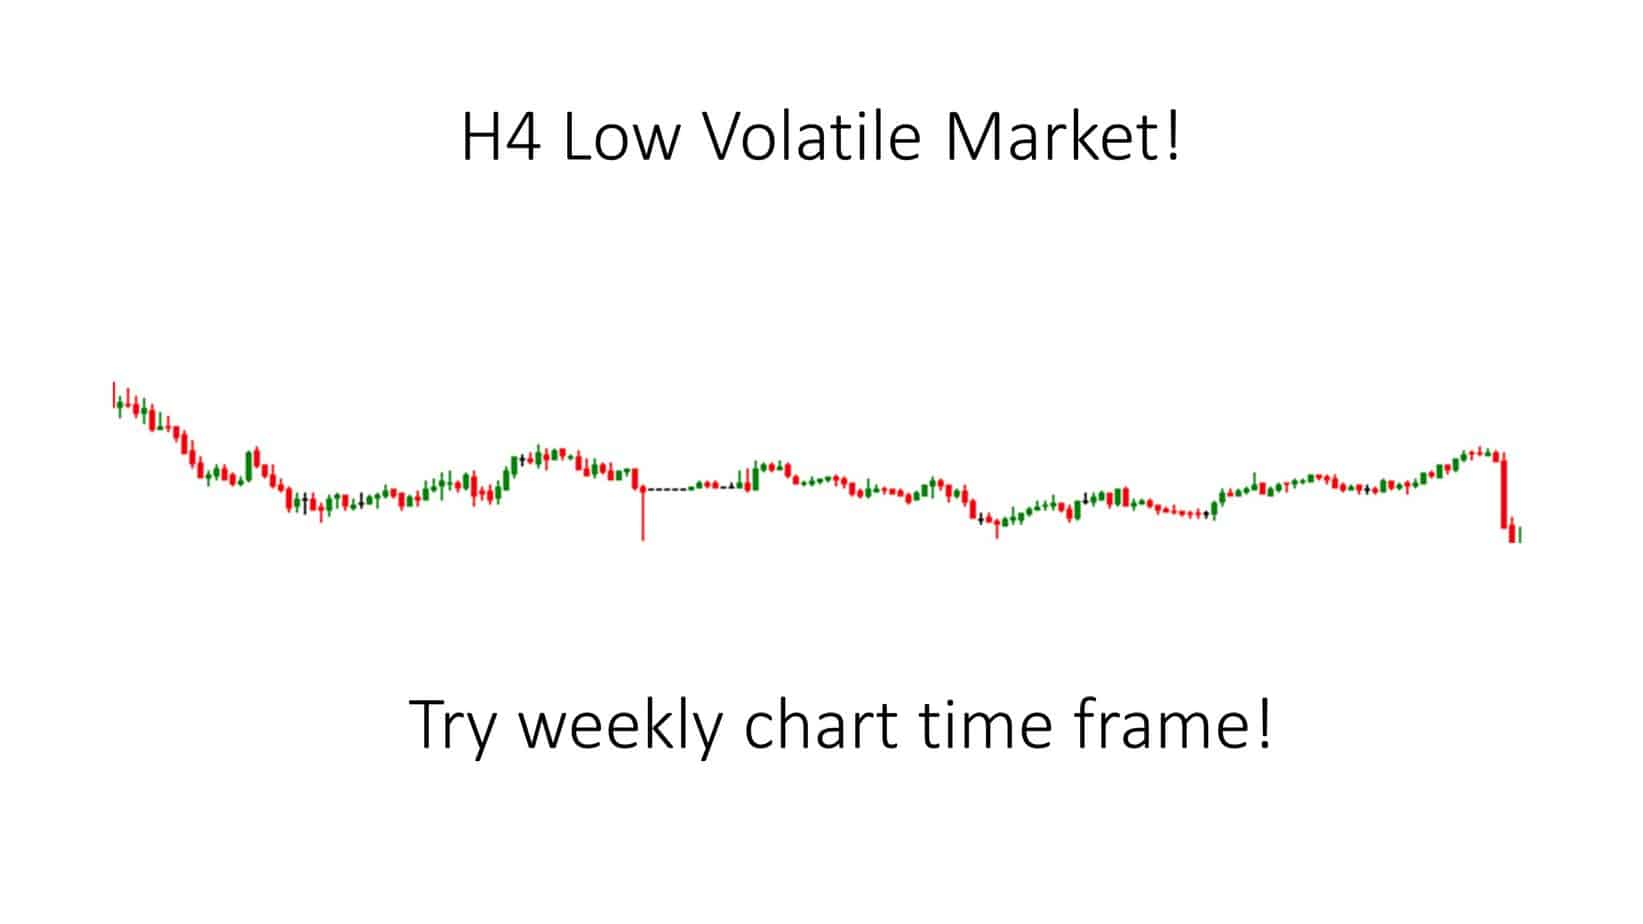
The daily time-frame is reliable in low and high-volatile markets!
If the chart on the H4 time frame has low volatility (range trading) or volatility is so high and unpredictable, daily or weekly charts are the perfect replacement for swing traders!
Nonetheless, there are more often employed periods than others, and the daily period is one of these. The same is valid for institutional investors and traders, such as mutual funds and other large institutions whose activities significantly influence the market. This means that most of the focus is on the market’s day-to-day fluctuations and that many individuals are poised to enter the market at the first sign of a price drop.
Minute bars, which nearly as many market participants don’t follow, aren’t almost as reliable or significant. Consequently, trading strategies like mean reversion and trend following tend to be pretty effective on daily bars.
After it has been proven that daily trading bars are beneficial, you may astonish if there is some logic in utilizing even higher periods, such as weekly or monthly bars. This is because it has been demonstrated that trading using daily bars is beneficial. You may use extended time-frames such as these to obtain a clearer idea of the general direction in which the trend is moving, or you could even apply some additional criteria, such as that the prior week’s closing price should be greater or lesser.
However, you can also achieve this using daily bars, which could make the weekly timescale unnecessary.
When you use more significant periods, there is also the possibility that you will begin to evaluate the fair with an extended-term perspective. This means you will need to maintain your positions for a significantly extended period to realize gains from them. And while the fact that this might not be a drawback in the literal sense of the word, it still might not connect with the goals you want to achieve as a swing broker.
To put it another way, you could make use of lengthier periods, but in all likelihood, you won’t require them. Regular bars provide a great deal of helpful information, and there is no requirement, at least initially, to explore other periods to get started with swing trading.
We wanted to give you a little rundown on a critical topic: the question of which graphic representation you ought to practice now that you are familiar with the period ideal for swing trading.
As a dealer in today’s market, you may take advantage of the plethora of excellent services that are accessible, including those that allow you to design trend lines and other analytic tools. Services such as those offered by investing.com and trading assessment are good instances of this service.
Conclusion
There are many good arguments for trading with daily bars, but if we have to pick two main ones, they would be that it takes a much shorter amount of time and also there are many excellent trading techniques to choose from. If you can obtain a hold of a swing trading method that is shown to be lucrative, you will be able to have your business rapidly operational. This is precisely what you’ll receive with the swing trading progression that we provide; in it, you’ll learn trading tactics that we’ve used for a significant amount of time with great success.
On the other hand, if you feel up to the challenge of developing a trading approach all on your own, you have the option to do so. Our beginner’s guide to creating your dealing system is the ideal starting point for those just getting their feet wet in the trading world.
In conclusion, H4 and daily time-frames are usually the best options for swing traders. Traders can use any combination of chart time frames to analyze the market. The daily bar time frame and H4 allow you to have much more flexibility and see current market conditions better when you plan several days’ trade.

He is an expert in financial niche, long-term trading, and weekly technical levels.
The primary field of Igor's research is the application of machine learning in algorithmic trading.
Education: Computer Engineering and Ph.D. in machine learning.
Igor regularly publishes trading-related videos on the Fxigor Youtube channel.
To contact Igor write on:
igor@forex.in.rs
Related posts:
- 1-minute Scalping Trading Strategy Example Using EMA20
- Intraday Swing Trading
- Is RSI Good For Day Trading? – RSI Time-Frame for Day Trading
- What is the Best Time Frame to Trade Forex?
- What is Time Frame in Forex? – Forex Time Frames Explained
- Download Swing ZZ MT4 indicator
- 4-Hour Time Frame Strategy
- Download MT4 Time Frame Indicator
- How to Add Custom Time Frame in MT4?
- Can you Swing Trade in a Roth IRA?
- The Best Time Frame for Support and Resistance
- What is Repainting in Forex? – Repainting Indicator Meaning & Examples
