Table of Contents
Price levels play a pivotal role in influencing decision-making among investors. Certain price levels, such as previous highs or lows, become significant because they serve as benchmarks to which the market has previously reacted, offering insights into potential future behavior.
These levels often act as psychological barriers or targets for traders, indicating supply and demand areas. When prices approach these levels, they can act as support or resistance, leading to potential trend reversals or continuations. Recognizing and understanding these critical points allows traders to make more informed decisions and anticipate potential market movements.


Supply and demand zones are specific price ranges on a trading chart where selling and buying interests, respectively, have historically been concentrated. A supply zone indicates an area where sellers have been dominant, often leading to a decline in price, while a demand zone highlights where buyers have previously taken control, typically resulting in a price increase. These zones are used by traders to anticipate potential price reversals and to set strategic entry and exit points.


How to Trade Supply and Demand Zones?
Traders usually generate sell orders in supply zones and buy orders in demand zones. However, traders set pending buy orders just above the supply area and pending sell orders just below the demand zone. In that case, traders enter a trend trading position if the price breaks strong support or resistance.
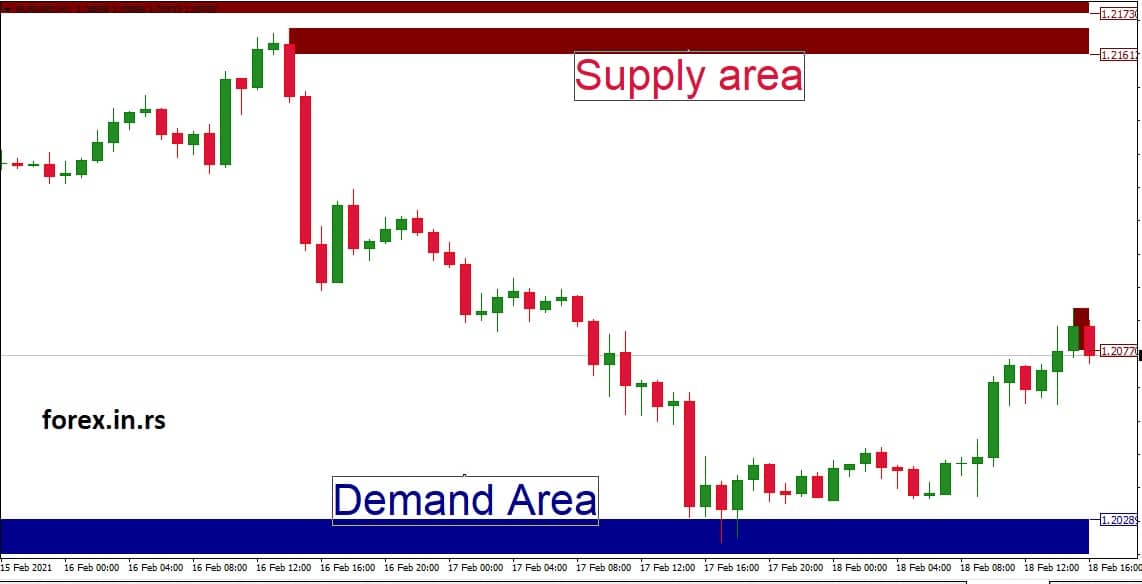
Let us watch the image above and set an example:
Supply Zone Example (1.1261 to 1.1273)
A supply zone is a specific area on the chart where sellers are more dominant, and the price tends to face resistance and might decline.

Example: Imagine you’re observing the GBP/USD chart. Each time the price reaches the zone between 1.1261 and 1.1273, you notice a substantial increase in selling activity, resulting in the price pulling back from this range. This behavior suggests a significant supply or selling interest at this level.
Now, while many traders might be inclined to generate live sell orders within the supply zone (anticipating a drop in price due to the selling pressure), some traders adopt a different strategy. They set pending buy orders just slightly above the supply zone. Why?
If the price strongly breaks through the supply zone, it might indicate a shift in market sentiment. This means the zone, once a significant resistance, could now act as a new support level. Traders placing buy orders above this zone anticipate that the momentum will continue upward.
Demand Zone Example (1.2016 to 1.2026)
Buyers are prevalent in a demand zone, and the price typically finds support, often bouncing upwards from this region.
Example: On that same GBP/USD chart, whenever the price dips into the range of 1.2016 to 1.2026, there’s a noticeable uptick in buying activity, causing the price to rise again. This repeated behavior implies a strong demand or buying interest at these levels.
While it’s standard practice for traders to generate live buy orders within the demand zone, some take a more anticipatory approach. They place pending sell orders just below the demand zone. The rationale?
If the price were to breach the demand zone with significant momentum, it could signify a change in market dynamics. The once-strong support (demand zone) might become a new resistance level. By setting sell orders below this zone, traders aim to capitalize on potential downtrends, anticipating the price will continue to drop.
In both scenarios, if the price breaks strong support (in the demand zone) or resistance (in the case of the supply zone), traders might interpret it as a potential start of a new trend. Consequently, they might enter trend trading positions, riding the price momentum toward the breakout. This approach combines the principles of both range-bound and trend-following trading strategies.
Supply and Demand Zones in Strong Bullish Trend
Traders usually generate buy orders in demand zones during bullish solid trends. However, traders close buy orders in the supply area during strong bullish trends and avoid trading against the trend. Additionally, traders can set pending buy orders just above the supply area during a strong bullish trend.
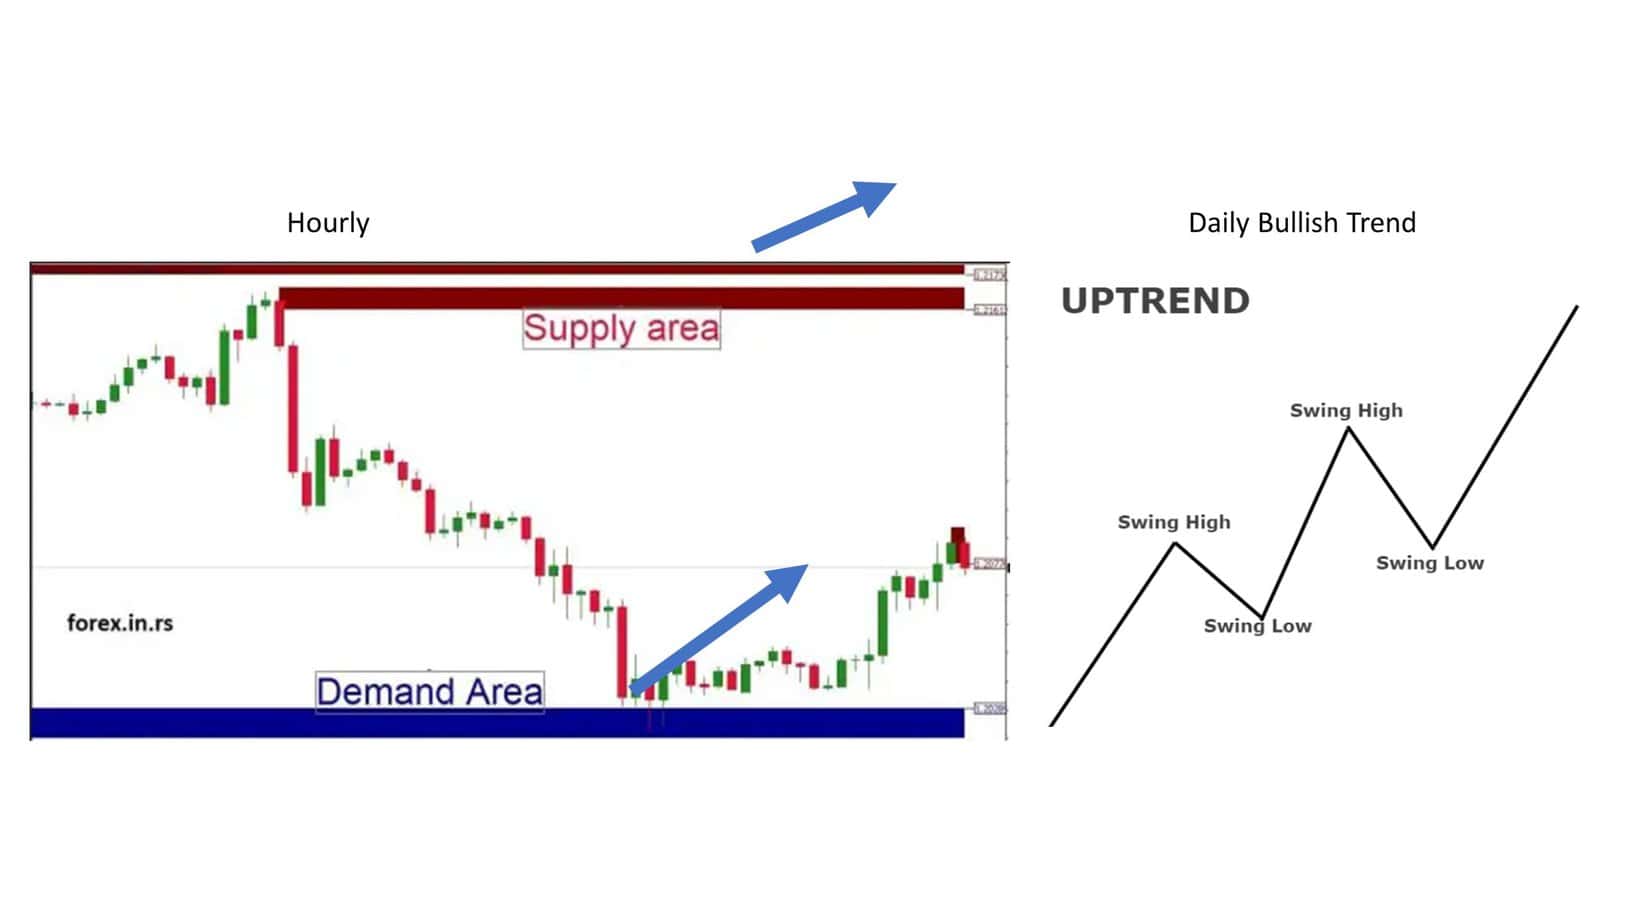
Imagine witnessing a robust bullish trend in the EUR/USD currency pair. The price consistently makes higher and lower highs, indicating strong buying momentum.
Demand Zone (1.2016 to 1.2026):
Demand zones act as mighty support pillars in a bullish market, reinforcing the trend’s strength.
Example: Buying activity intensifies each time the EUR/USD price dips into the 1.2016 to 1.2026 range. Observing this, traders recognize the zone as a lucrative buying opportunity per the overarching bullish trend. Consequently, they generate live buy orders, capitalizing on the anticipated bounce from this zone and riding the subsequent upward price wave.
Supply Zone (1.1261 to 1.1273):
During a solid bullish trend, the dynamics at the supply zone change. Instead of acting as barriers, these zones become areas of caution.
Example: Traders become wary as the GBP/USD price approaches the supply zone of 1.1261 to 1.1273. Given the solid bullish sentiment, they anticipate that the price may not significantly retract from this zone. Instead of setting sell orders, they close their buy positions, taking profits before potential minor pullbacks. They avoid initiating new sell orders because doing so would mean trading against the dominant bullish trend, which is riskier.
Moreover, anticipating the possibility of a breakthrough in the bullish momentum, traders set pending buy orders just above the supply zone. If the price pierces through the supply zone and triggers these orders, it indicates a continuation of the bullish trend. This strategy ensures traders can catch the next wave of buying momentum, further capitalizing on the trend’s strength.
Supply and Demand Zones in Strong Bearish Trend
Traders usually generate sell orders in supply zones during bearish solid trends. However, traders close sell orders in the demand area during strong bearish trends and avoid trading against the trend. Additionally, traders can set pending sell orders just below the demand area during a strong bearish trend.
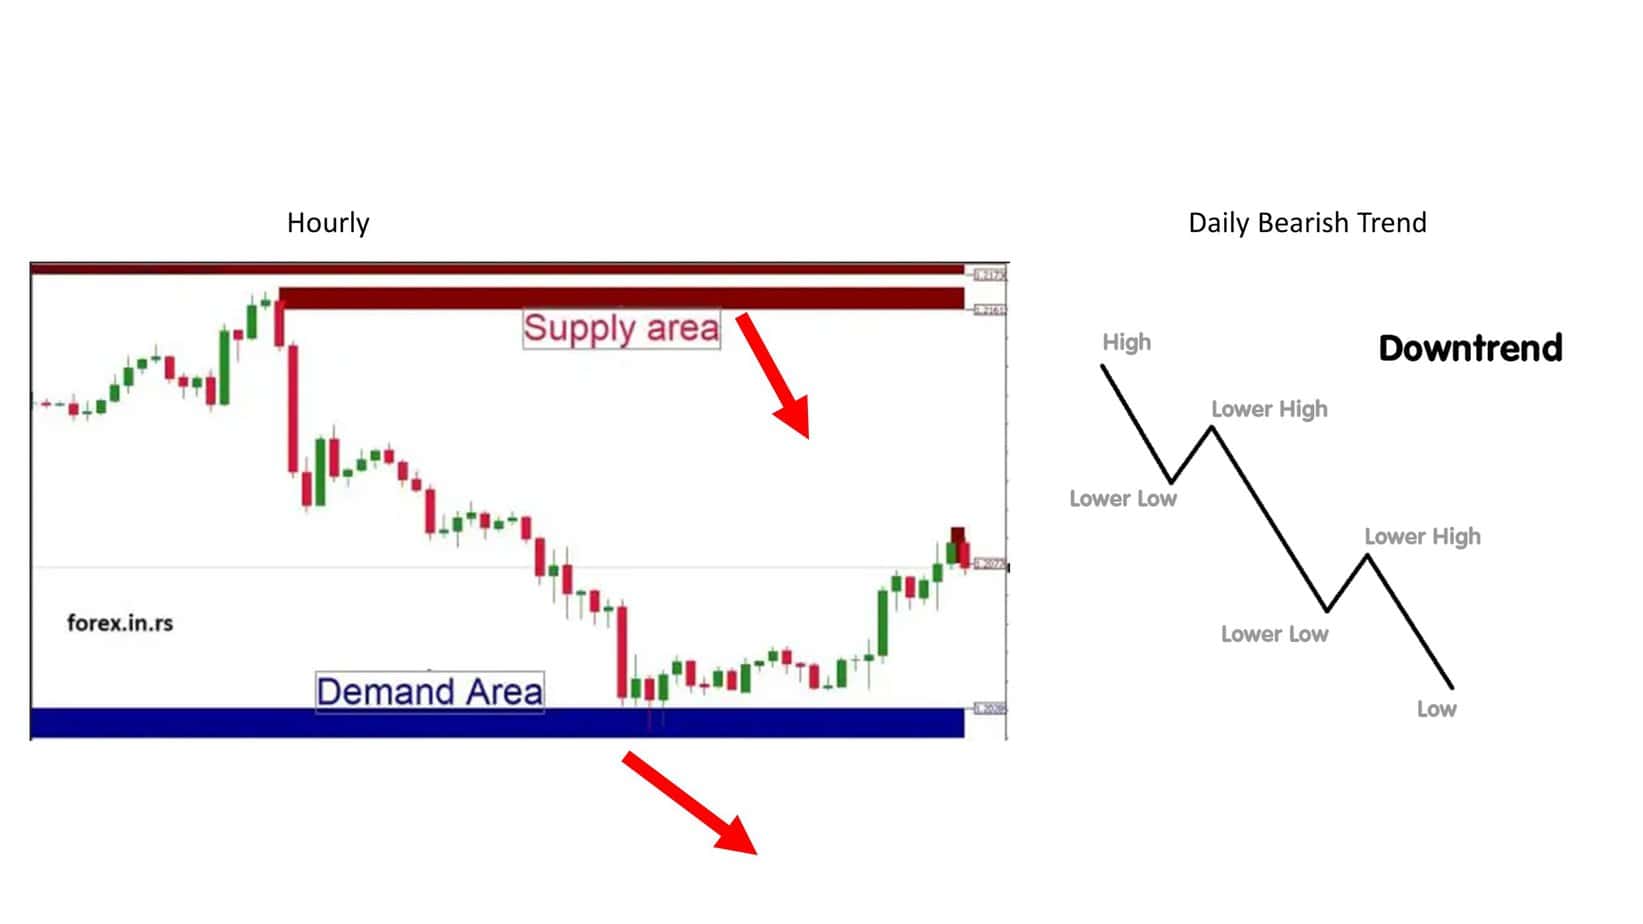
Consider that the GBP/USD currency pair is currently in a pronounced bearish trend. The chart shows a persistent lower and lower highs pattern, indicating dominant selling pressure.
Supply Zone (1.1261 to 1.1273)
In a bearish climate, supply zones are reinforced as regions of heightened selling activity, acting as a catalyst to further the downward trajectory.
Example: Selling activity surges each time the GBP/USD price ascends towards the 1.1261 to 1.1273 range. Observant traders perceive this zone as an optimal entry point for short positions, aligning with the prevailing bearish sentiment. Consequently, they generate live sell orders when the price reaches this zone, expecting a continuation of the downward movement from this area.
Demand Zone (1.2016 to 1.2026)
During a deep-rooted bearish trend, the dynamics surrounding demand zones shift. Rather than acting as solid foundations for price reversals, they become temporary relief or hesitation zones.
Example: Traders remain cautious as the GBP/USD price approaches the demand zone of 1.2016 to 1.2026. Recognizing the overarching bearish momentum, they anticipate that while the price might stall or even show a minor upward correction, it’s unlikely to reverse the trend. In line with this, they decide to close their sell positions to pocket profits, foreseeing a potential pause or minor rally. They refrain from initiating buy orders since doing so would contradict the prevailing downtrend.
Furthermore, anticipating a potential breach of the bearish momentum, traders place pending sell orders just below the demand zone. If the price decisively breaks the 1.2016 support, activating these orders validates the trend’s continuation. This strategy ensures traders re-enter the market, positioning themselves to capitalize on a further potential decline.
Supply and Demand Zones in a Range Trend
During the range trend, traders usually generate buy orders in demand zones and sell orders in supply zone. However, during range trading, traders set a tight stop-loss just above the supple zone for sell traders or a stop-loss below the demand zone.
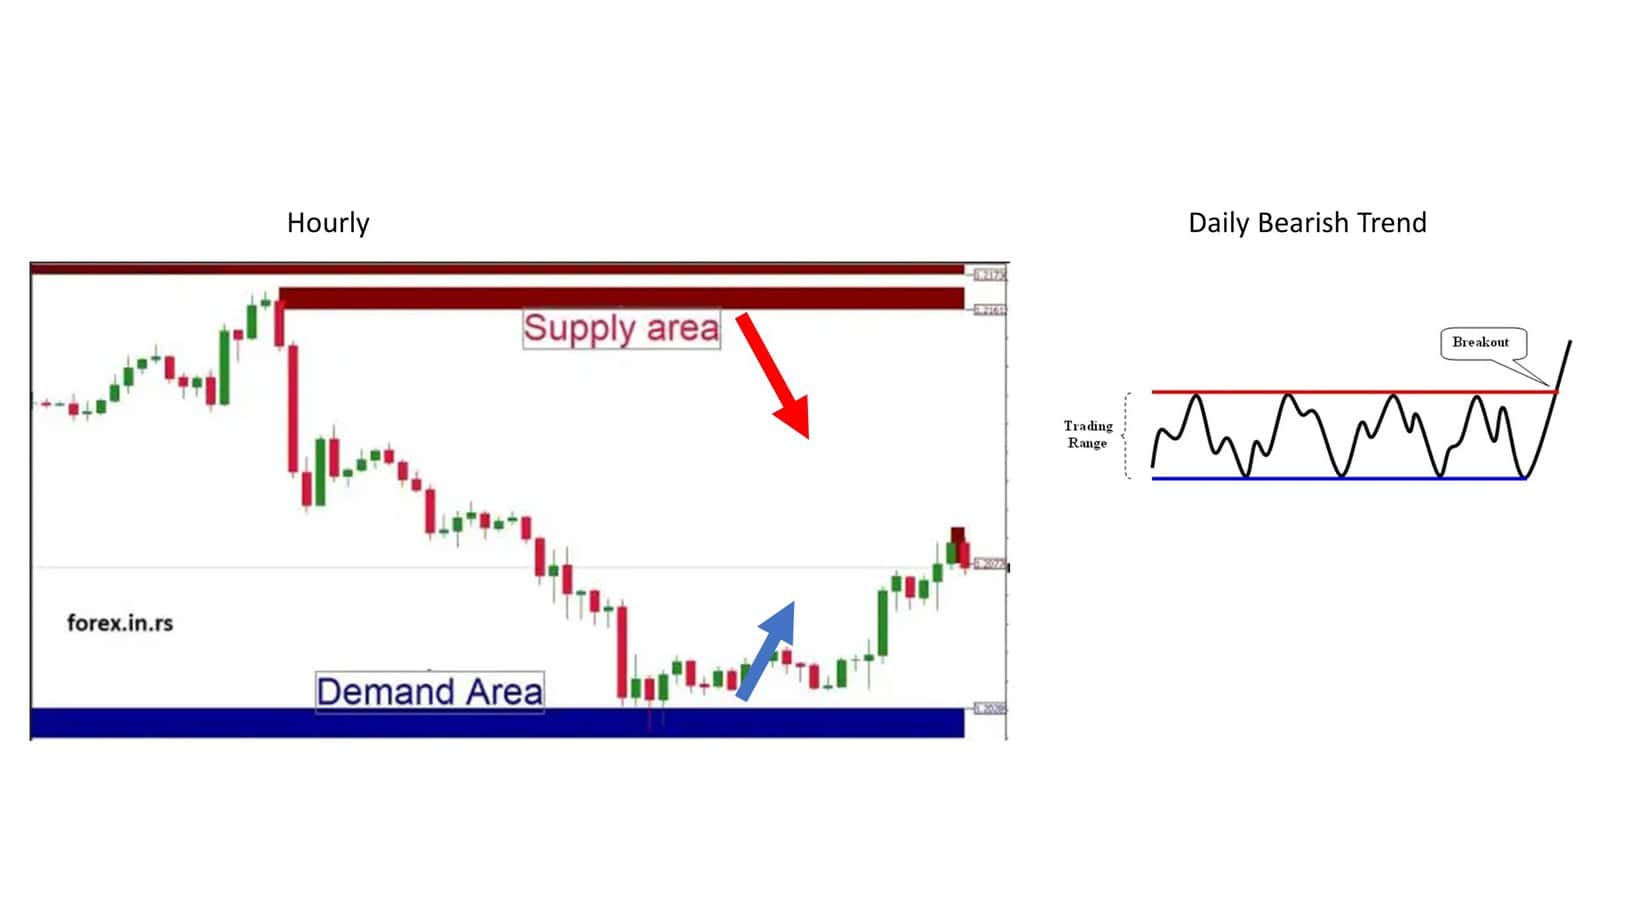
Suppose we’re analyzing the GBP/USD currency pair, which, upon close examination, seems to be oscillating between two distinct levels for an extended period, neither showing a strong upward nor downward bias. This sideways movement of the currency pair is indicative of a range-bound market.
1. Supply Zone (1.1261 to 1.1273):
The supply zone is a price ceiling in a range-bound market, where selling interest intensifies and halts upward price movement.
Example: Over the past few weeks, a surge in selling activity is observed every time the GBP/USD price climbs towards the 1.1261 to 1.1273 range. By recognizing this consistent pattern, traders generate live sell orders each time the price touches or approaches this zone, capitalizing on the short-term downward price movements that typically follow.
To manage risk, especially given the absence of a strong trend, traders set a tight stop-loss just above the supply zone, say at 1.1275. This ensures that their potential losses are minimized if the price unexpectedly breaks through the supply zone and moves upward.
2. Demand Zone (1.2016 to 1.2026):
Conversely, in the range trend, the demand zone emerges as the price floor, where buying interest consistently outpaces selling, pushing the price back up.
Example: Observing the GBP/USD chart, traders notice that whenever the price dips to the 1.2016 to 1.2026 range, there’s a pronounced uptick in buying, causing the price to bounce back. Capitalizing on this predictable behavior, traders generate live buy orders within or close to this demand zone, taking advantage of the anticipated upward movement.
Traders set a stop-loss just below the demand zone to protect their positions from unexpected downturns, possibly around 1.2014. This provides a safety net, ensuring they exit the trade with minimal losses if the price plunges beyond the established demand zone.
Conclusion
Understanding the dynamics of supply and demand zones is crucial in a pronounced bullish trend. Demand zones become key buying opportunities, while supply zones transform into areas for profit-taking and potential trend continuation. By strategically aligning their actions with these zones, traders can optimize their positions, maximizing profits and minimizing potential risks.
Navigating a distinct bearish trend requires a nuanced understanding of supply and demand zones. In such a trend, supply zones become pivotal selling opportunities, while demand zones serve as regions for profit realization and potential re-entry. By tailoring their strategies around these zones, traders can enhance their trading efficacy, maximizing potential returns while safeguarding against undue risks.
In range-bound markets, supply and demand zones become incredibly reliable tools for traders to strategize their entries and exits. By buying at the demand zone, selling at the supply zone, and setting tight stop-loss orders outside these zones, traders can maximize potential profits while effectively mitigating risks associated with sudden price breakouts from the established range.

He is an expert in financial niche, long-term trading, and weekly technical levels.
The primary field of Igor's research is the application of machine learning in algorithmic trading.
Education: Computer Engineering and Ph.D. in machine learning.
Igor regularly publishes trading-related videos on the Fxigor Youtube channel.
To contact Igor write on:
igor@forex.in.rs
