Table of Contents
This article will explain the entire technique for trading that takes only 4 hours a week from the investor’s schedule, known as the Forex 4 hours chart. This strategy can be used to target long momentum and shifts.
If you have a full-day job and other liabilities that cut your investing time on graphs, then 4-hour chart trading strategies can provide several advantages.


Please read our Best Moving Average for 4-Hour Chart analysis in our article.


4-Hour Time Frame Strategy
Forex, a 4-hour strategy, is based on trend lines analysis using the 4-hour chart. Usually, indicators and trend lines on a 4-hour chart give trading opportunities valid from a few hours to several days.
The 4-hour chart time frame strategy is a standard method used by day traders and swing traders in the forex and stock market. It balances longer-term trends and shorter-term price action, offering a compromise between noise and significant trends.
Forex 4-Hour Chart Strategy Steps
- Analyze trends on the 4-hour chart using trend lines: Start by drawing trend lines on the 4-hour chart. A rising trend line (connecting higher lows) can show an uptrend, while a falling trend line (connecting lower highs) can show a downtrend. This will give you an overall idea of the market’s direction.
- Check important news that can cause colossal volatility shortly and change the trend: In addition to technical analysis, check the economic calendar for news releases that can cause significant volatility. For example, data releases like GDP, Non-Farm Payrolls, Central bank decisions, etc., can significantly impact price movements.
- Wait to enter into a trade when the EU and US trading sessions overlap: This usually is when the forex market is most active and volatility is higher. It usually happens between 8:00 AM and 12:00 PM Eastern Standard Time (EST).
- Check for any divergence on the chart using RSI or MACD oscillator: Divergence occurs when the price makes higher highs (or lower lows), but the oscillator (like RSI or MACD) is not. This indicates that the trend may be losing strength and could reverse.
- Draw trend lines on the RSI indicator: This is similar to that on the price chart. It can help confirm the trend or identify divergence.
- Wait for a pullback to enter a trade or enter the daily high price if the fundamental analysis is on your side: A pullback occurs when the price temporarily moves against the trend but continues in the original direction. This can be an excellent opportunity to enter a trade at a better price. Alternatively, if the fundamentals favor the trend, you could enter at the daily high price (in an uptrend) or low price (in a downtrend).
- Enter into a trade if several triggers confirm your analysis (trend, economic news, overall trend, indicators): Don’t just rely on one signal. Instead, look for confirmation from multiple sources. If the trend, news, and indicators point in the same direction, this can be a solid signal to enter a trade.

All over the forex market, a 4-hour chart is equally essential. As general stock markets get accessible between 8 a.m. to 9 a.m., the four-hour chart implication can be reduced. It will be good for traders to look upon the daily graph rather than a four-hour chart as it shows only two bars each day of the market.
We know that the 4-hour time frame is crucial in Forex. The market operates 24×7, and traders are lancing across the globe. Each provincial trading term is divided into two parts by a 4-hour candle. Shareholders can benefit by searching for new access, but any of these methods will show a noticeable difference.
Shareholders in the Foreign Exchange market are dealing across the globe.
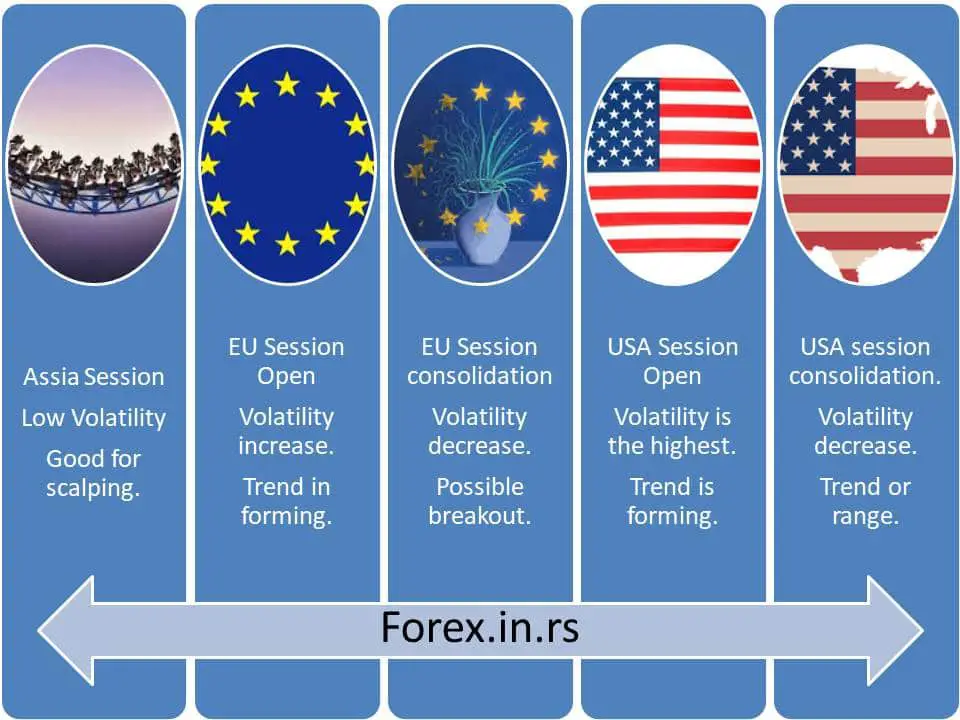
The US Session
- The US session can display the actions of both Asian and London sessions.
- And the overlap is treated as the worst period of the day.
The London Session
- Loquacity is provided across Europe.
- The term London has a facility for speedy and efficient moves.
The Asian Session
- Loquacity starts to come from Wellington, New Zealand.
- The Asian term has a more significant bias to hold ranges concerning support and resistance.
Shareholders can supervise stocks to explore new willingness areas by glancing at the stock variation and circulations on these 4-hour graphs.
Keep looking at 4-hour candles, considering each end as New York wind-up is familiar to portray ‘financial time,’ candles finishing at 5 a.m., 9 a.m. & 1 a.m., and p.m. (depending upon ET). Pacific Timings are 2 a.m., 6 a.m., and 10 a.m. or p.m., although Central hours are 4 a.m., 8 a.m. & midnight or p.m.
Forex 4-Hour Chart Strategy based on Moving Average
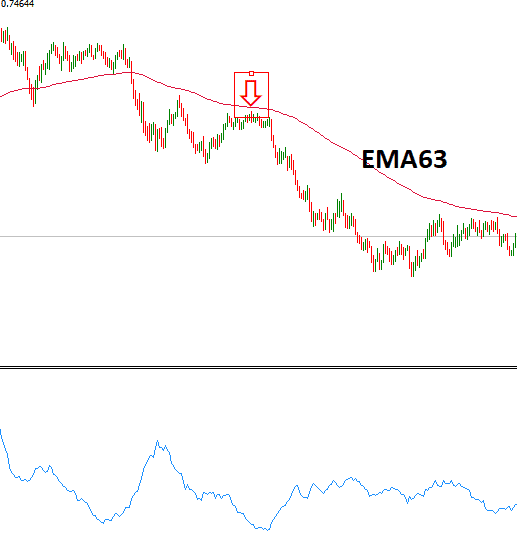
Forex’s 4-hour chart strategy using the Moving average is based on a pullback strategy. A trader can enter into a position after a short time pullback and then enter into the trade to continue the primary trend.
For example, if the price on the 4-hour chart breaks the moving average line (for example, EMA63), w will wait to see upward momentum and then enter into a trade like in the image below:
Forex 4-Hour Chart Strategy Based on Supply and Demand
Forex 4-hour chart strategy based on supply and demand implies that the trader enters into a trade if the price on the 4-hour chart oscillates in the supply or demand zone like in the image below:
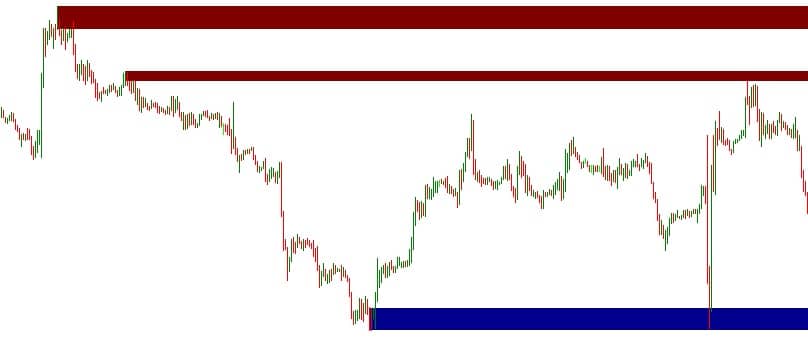
To use this strategy, please download the supply and demand indicator.
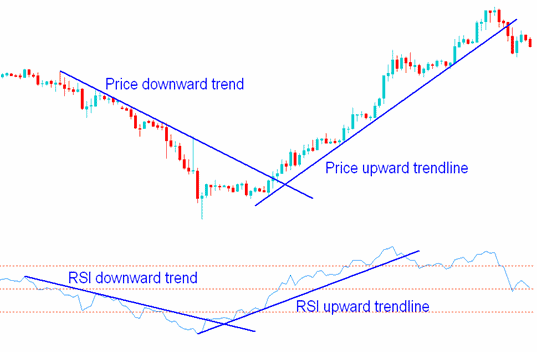
Forex 4-Hour Chart Strategy using RSI trend lines
Forex’s 4-hour chart strategy using RSI trend lines is based on simple lines you manually draw on the RSI indicator. In this case, you can spot the proper breakout more accurately than an ordinary chart.
Manage Your Trade
Market contestants have made trade outlines for any part they might carry on with, so they look at graphs at each 4-hour mark.
Explorers will generate profit while looking for new events by utilizing the end of each 4-hour candle to change break (specifically the break-even pause). If the method gets properly entrenched, shareholders will move even more by getting their halt in extension to include in profits. Just apply your knowledge and trade with precautions!

He is an expert in financial niche, long-term trading, and weekly technical levels.
The primary field of Igor's research is the application of machine learning in algorithmic trading.
Education: Computer Engineering and Ph.D. in machine learning.
Igor regularly publishes trading-related videos on the Fxigor Youtube channel.
To contact Igor write on:
igor@forex.in.rs
