Table of Contents
Support and resistance levels are the critical thresholds where the market trend is most likely to pause and change course. This may be a particular price/price field. Interpretation of support and resistance depends on the period of a dealer. To support the price pattern, it is better to use it in combination with other metrics, such as Fibonacci retracement ratios, moving averages, trendlines, etc. However, based on price, assistance and resistance levels may be traded.
In the previous article, we defined support and resistance levels in forex:


What is the support level?
Support level represents a hypothetical price level or price area supporting or holding up prices and signifying more forex buyers than sellers. Support is often viewed as a “price floor” because traders hypothetically expect that price change direction and begin to rise based on past performance.


What is the resistance level?
The resistance level represents a hypothetical price level or area consolidating, declining new high prices, and signifying more forex sellers than buyers. Resistance is often viewed as a “price roof” because traders hypothetically expect that price to change direction and begin to fall based on past performance.
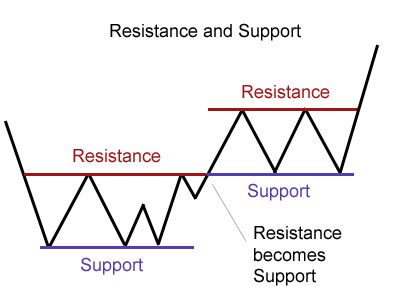
A support level is when consumers move in and get more competitive, stopping the price from falling. Because of the lower price, selling pressure reduces as the price drops for support, and consumers become more competitive because of these lower rates. The support mark will inevitably be breached, and the price will fall below it. Then the price will become the potential standard of resistance. A resistance level means sellers move in to become more competitive and prevent rates from soaring. Buying demand reduces because of higher costs, and sale pressure rises as price rallies against resistance. Ultimately, a resistance barrier will break out, and the price will climb above it. This price would be the potential support level.
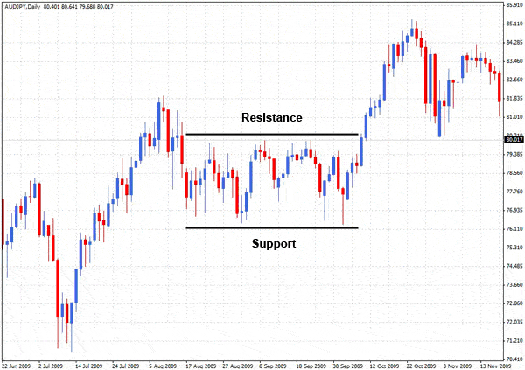
See an example of how former resistance becomes support:

The Best Time Frame for Support and Resistance
The best time frame to draw support and resistance is M30 for day traders, H4 and Daily for swing traders, and Weekly and Monthly for long-term traders. However, professional traders use all chart time frames to add significant levels for any trading asset.
The best time frame to draw support and resistance lines is M30 for day traders, H4 or Daily for swing traders, and Weekly or Monthly for long-term traders. Support and resistance levels are essential in technical analysis because they indicate where buyers and sellers may have previously assembled in large numbers.
So usually, traders determine the best time frame for support and resistance based on strategy type, such as:
- The Best time frame to draw support and resistance for intraday trading is M30. However, if the market is too volatile, you can use H1 or H4.
- The Best time frame to draw support and resistance for swing trading is the H4. However, you can use a Daily chart if the market is too volatile.
- The Best time frame to draw support and resistance for position trading is the Weekly time frame. However, you can use a Monthly chart if the market is too volatile.
Support levels are typically found at significant price lows, while resistance levels are usually at significant price highs. These areas represent potential turning points for a market, as many traders will buy or sell at those levels based on their own beliefs about whether the market is likely to continue rising or falling.
No one-time frame is best for finding support and resistance levels. Instead, it depends on your trading style and the type of market conditions that you are trading in. For example, if you are a short-term day trader, you may want to use a shorter time frame like M30 to capture quick moves in the market. Likewise, if you are a swing trader looking to hold longer-term positions, you may want to use a larger time frame like H4 or Daily to get more out of your trades.
In addition to using different chart time frames for support and resistance analysis, it is also important to include multiple types of indicators when drawing these lines. For example, some traders prefer using trendlines instead of horizontal lines since they capture both up-and-down trends more effectively. You can also add Fibonacci retracement levels or moving averages to help confirm where previous price movements were likely supported or resisted by large groups of buyers or sellers.
Ultimately, the best way to find support and resistance levels that work well in your trading strategy is through practice and experience. As you become more familiar with how various markets move over different time frames, you will be better able to identify key price points where other traders may be waiting with orders ready to buy or sell based on their expectations about future movements in the market.
Let us analyze one example using forex charts with support and resistance levels.
On the EURUSD chart using the H4 time frame, I added the daily low, daily high, monthly low, and monthly high.
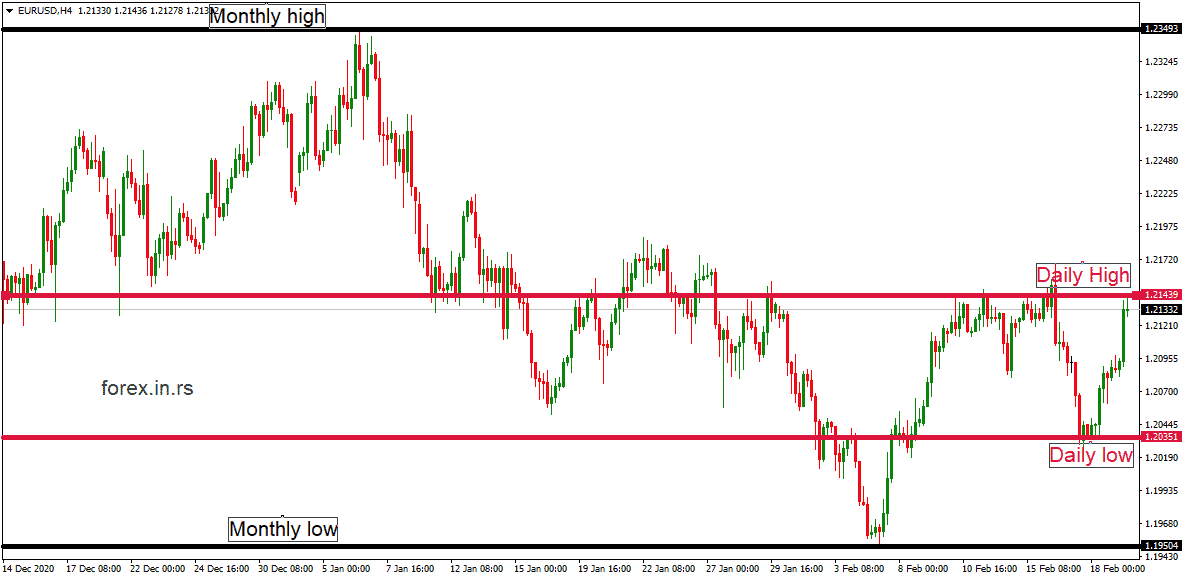
On this weekly chart, the high is almost equal to the daily high. Usually, one price level can be high or low in trading for several different time frames. For example, if the current price is the highest high for the last 30 days, this level is at the same time daily, weekly and monthly high.
The higher time frame means a higher impact of support or resistance level. For example, a monthly high affects trading more than a daily high. In that case, if the price breaks the monthly price high, we can expect a more significant movement than if the price breaks the everyday high price.
Professional traders use all chart time frames to add significant levels for any trading asset. For example, famous trader Michael Boutros on his chart, adds all kinds of previous highs and lows, Fibonacci levels, Andrews Pitchfork indicator, channels, and trendlines. See the chart below:
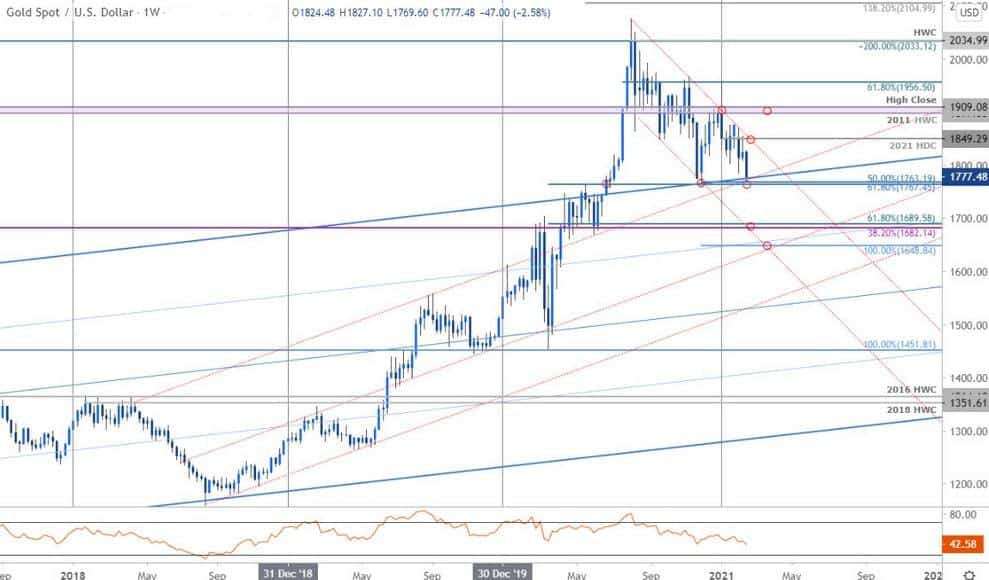
Gold price analysis – chart created by Michael Boutros, the intraday trader
As you can see, this professional trader added high and low prices for 2016 and 2018 (a few years ago) on the same chart. On his chart (analysis for 18. February 2021.) are yearly support and resistance levels, weekly support and resistance levels, and monthly support and resistance levels. He added basic levels using multiple time frame analyses. So, all time frames are necessary for this trader, although he is an intraday trader.
Traders’ charts have several degrees of support and resistance at every period to enter and exit the market. The importance of support/resistance is all about the trading period, whether the deal is long/short, and the number of times the graph indicates the importance of a specific price or region.
As a trader, you must decide which thresholds are most crucial for your trading plan and for particular time frames. For instance, it would be more relevant than a daily chart to recognize support/resistance on a weekly chart, which would be more beneficial than an intraday chart. There is generally little relevance to intraday support and resistance ranges if you are a short-term swing trader.
Note perception is somewhat arbitrary, and market actions can help decide the move at various stages. Indicators promoting understanding of the levels establish primary and minor support or resistance levels.
How to identify key price levels in forex for support and resistance?
The key support and resistance levels can be:
- Previous low and high (previous daily low, daily high, monthly low, monthly high, etc.)
- Trendlines
- Fibonacci levels
- Pivot point levels
- Price channel
- Andrews Pitchfork channel
- Supply and demand areas
- Moving averages
- Custom indicators
People are surprised when they see that the moving average can be used as a support or resistance level. A widely used analytical measure is moving averages. It helps in smoothing the uncertainty and assists in understanding and validating price behavior perception. Moving averages can be implemented to validate or facilitate the knowledge of support or resistance levels and evaluate primary levels for continuity and reversal of patterns.
Simple and exponential are the two typical moving averages being used.
- Simple – It takes the closing rate over a fixed time duration and calculates the moving average offered to every rate point with equal weight. It gives a later signal than a moving average of exponentials.
- Exponential – It takes the closing rate measured for a particular time; the moving average is calculated by assigning greater weight to the existing price points. It gives a signal earlier than a simple moving average.
Moving averages can be used, like any other technical indicators, combined with other indicators. Usually, traders use Moving averages with periods 10, 20, 50, 100, and 200 as support and resistance levels. The longer the duration, the greater its future value of it. A moving average of 200 periods would have a more significant impact than a period of 10.
A change in signal from the 200 moving average would be less significant than a daily chart on an intraday chart. Markets are dynamic, and history does repeat itself. Like that, moving averages are active with their usage at any given time or chart.
It would help if you decided about the period you are attempting to trade– short, moderate, or long term to determine which period you can choose. The short-term intervals are 25 or fewer days, the mid-period is 25 to 100 days, and last but not least, long-term periods are said to be 100 to 200 days.
With practice and persistence, you will soon master the concepts and will be able to trade with confidence.
Conclusion
The main idea is not to describe how we can determine and draw support and resistance levels. The main goal of this article was to explain that all time frames were necessary for trading decisions.

He is an expert in financial niche, long-term trading, and weekly technical levels.
The primary field of Igor's research is the application of machine learning in algorithmic trading.
Education: Computer Engineering and Ph.D. in machine learning.
Igor regularly publishes trading-related videos on the Fxigor Youtube channel.
To contact Igor write on:
igor@forex.in.rs
