Table of Contents
Trading the critical price levels is the most crucial trading rule. In this article, we will learn more about supply and demand zones.


What are supply and demand zones in forex?
Supply and demand zones (SND) represent the horizontal price accumulation area on the chart where traders hypothetically expect that price change. While resistance or support lines are determined, supply covers many resistance price levels, and the demand zone covers several support price levels.


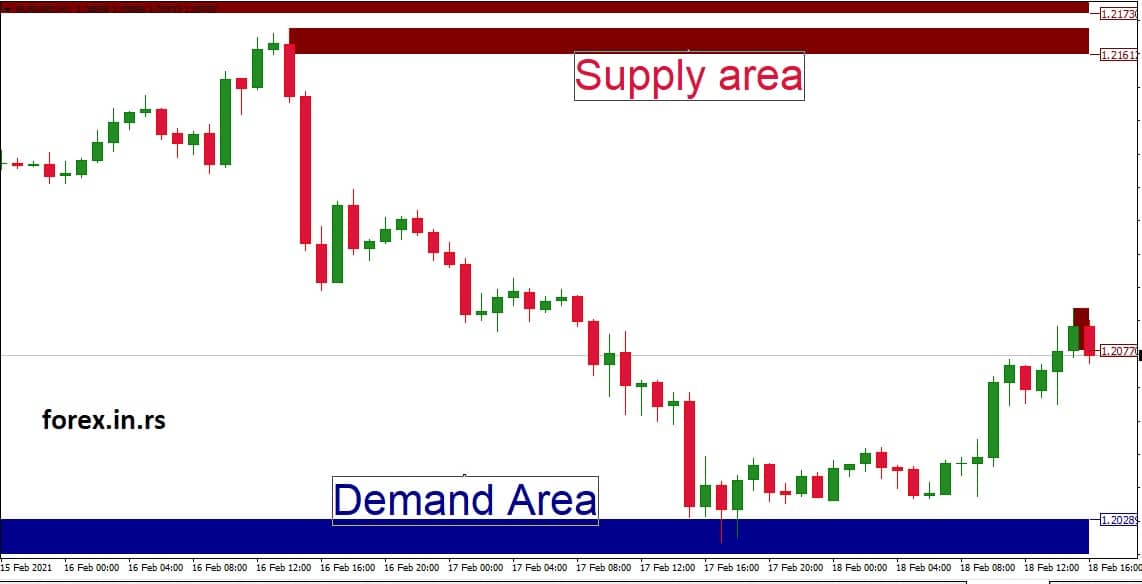
Supply zones (red color on image) are areas on the chart covering active resistance levels where traders usually place sell orders. Demand zones (blue in the picture) are areas on the chart covering operational support levels where traders usually place buy orders.
Download the Supply and Demand zones MT4 indicator.
Below, you can download the Supply and Demand zones indicator to draw basic price levels and areas for potential buy and sell orders.
Download supply and demand zones indicatorMT4 and the Demand-Supply Zones

The demand-supply zones determine the zones in the Forex chart of two currency pairs. When it comes to trading forex through MT4, different colors can indicate these zones. These colored zones indicate the expected price movements to the traders.
For example, let’s assume that there are two colored zones in the MT4. The white color signifies the recently retracted prices in the chart. The grey zone covers the prices that have not been touched yet. If the trader understands how to use these zones properly, they can easily make out the Fibonacci retracement among these zones.
Indicators of The Demand and Supply Zones
Even for beginners, the demand and supply zone indicators are not difficult to understand. On the contrary, they are easy to use because they are similar to the support and resistance levels. For example, the demand zone is identical to the support level in a price chart. When the price hits this zone, it can move back upwards. The demand zone or the support is also known as the buying zone.
Similarly, the supply is similar to the resistance zone in a price chart. It is the zone from where the price retraces back downwards. This zone indicates the selling signal.
Another vital point to remember while trading forex using MT4 is to check the white and grey zones. The white zone is safe as the price has already been examined in this zone. However, the grey zone signifies the potential price movement and cannot be fully trusted.
How do we find supply and demand zones in forex?
To find supply and demand zones in forex, draw several support and resistance lines on the chart and determine areas where the price has often approached. You can download an indicator that draws supply and demand zones on the chart for each time frame.
Are supply and demand the same as support and resistance?
Differences between supply and demand areas and support and resistance levels are only in terminology because supply and demand areas are broader than resistance and support. While support and resistance are price levels, supply and demand zones are price areas. For example, the demand area can have several support levels; the supply area can have several resistance levels.
A Forex Trading Guide Based on Demand and Supply
A general phenomenon for determining prices is supply and demand in any field. This is precisely how prices in the foreign exchange market are also determined. Therefore, to understand the rise and fall in prices and anticipate the price in the future, it is imperative to understand demand and supply, which is the determiner. Read with us to learn how demand and supply function in trading markets, how to strategize the use of demand and supply in the market, how demand and supply zones function, and how to use supply and demand strategies to your benefit.
How do supply and demand areas work?
At times, currency pairs rise to reach the resistance area called the selling zone, where it is understood that the sellers have a good potential of selling at an inflated price. However, the opposite scenario can also work out when the currency pairs fall to low prices, known as the demand zone, where there is potential for the buyers to buy at a good value. Therefore, understanding the forces of demand and supply is essential in understanding the jump in prices at various levels.
Supply and demand zones can be understood as certain areas on the forex chart where price has been fixed numerous times. There are support and resistance lines; however, we can identify specific lines by studying supply and demand. The traders can customize the forex charts for arriving at these supply and demand zones.
Now that you know the basics about demand and supply function in a forex market, let us provide valuable tips for trading in foreign exchange markets.
Supply and demand indicator MT4 download
Consider long time frames for arriving at the demand and supply zones: At times, the supply and demand zones do not coincide in the same area because the currency pairs reveal only one of the two. Therefore, looking at the forex chart from a distance is essential. You must carefully observe this area and mark it out distinctly to denote this portion.
Keep an eye out for the strong moves made in the supply and demand zone: There can be either a bullish or a bearish trend at varied price levels. Since more prominent institutions such as banks and institutional traders head fast to capitalize on this opportunity, the price range rises and drops instantly. Since many price alterations and capitalization occur at this price, it can become an important area and thus be demarcated as the supply and demand zone.
Employ other indicators to identify the supply and demand zones: It is integral to have the proper supply and demand zone identified, which can be done by employing other indicators alongside pivot points. Additionally, traders must look for support and resistance levels for better probability trading. Finally, Fibonacci levels can aim for greater accuracy in the supply and demand zones.
Let us also look at specific strategies to help trade based on supply and demand.
Strategies for Using Supply and Demand While Trading
Multiple trading strategies for demand and supply can be employed for the best trading experience.
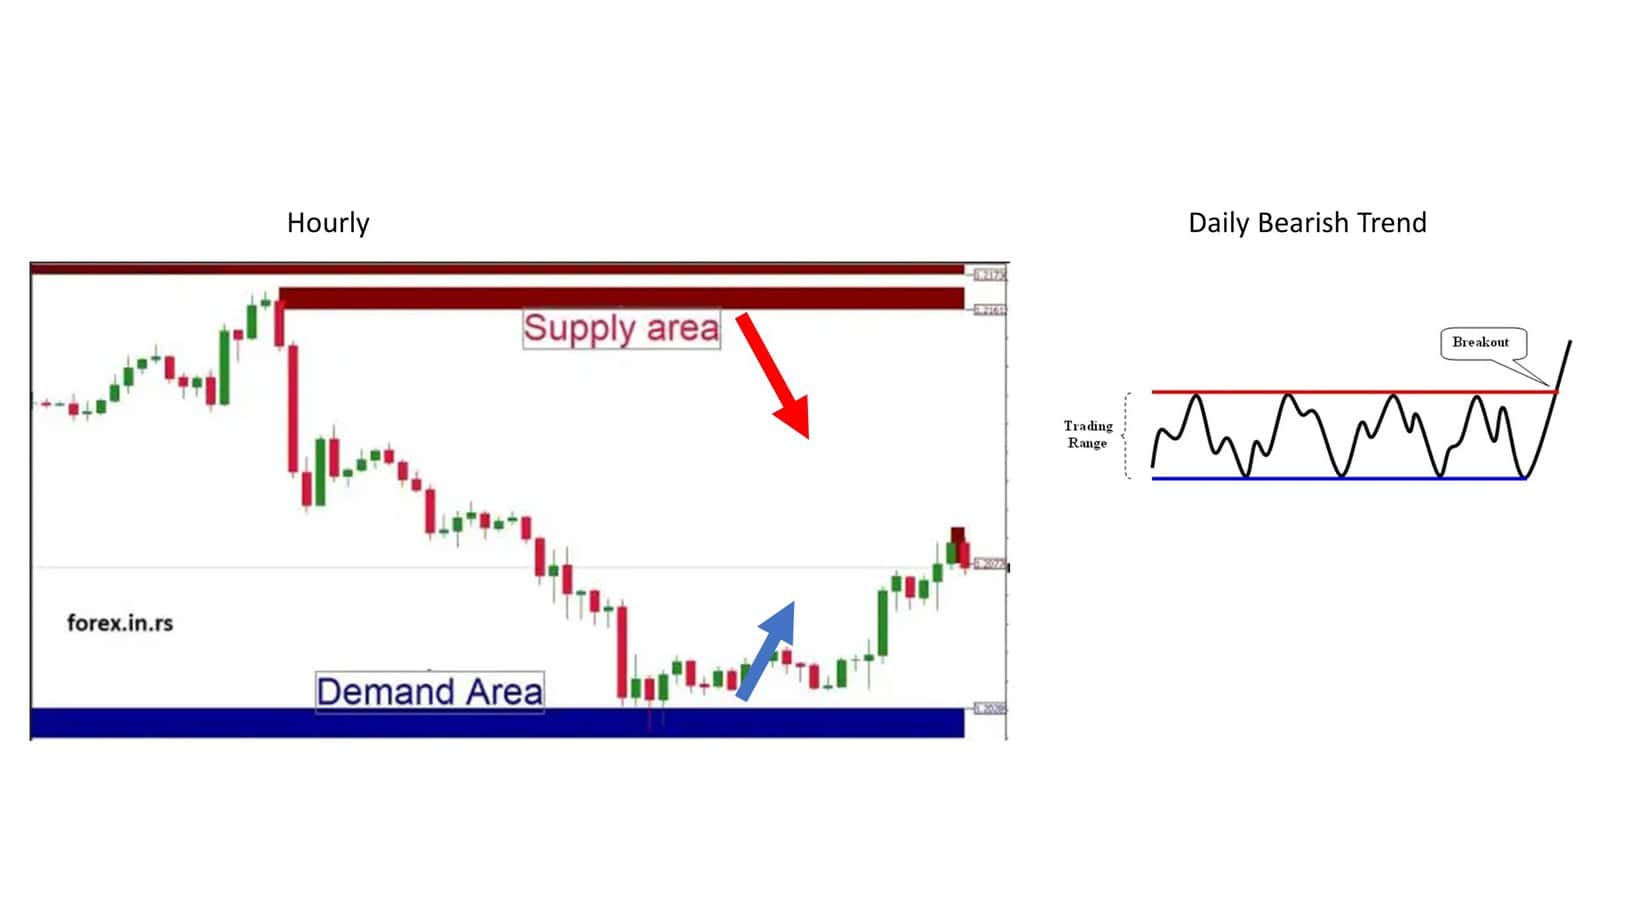
- Range Trading Strategy: By adequately identifying the supply and demand zones, range trading becomes another plausible option. The traders can employ other indicators, such as RSI or stochastic indicators, to observe overbought and oversold conditions. This trade with no specific direction makes watching short and long entries possible. Therefore, traders can view the chart from a distance, considering the long-term entry points and smaller time frame entries.
- Breakout Strategy: Another strategy that can be used considering demand and supply is the breakout strategy. We know that price can never be constrained within a range, and it will shoot in a direction as time passes. Therefore, under this strategy, traders look for a good entry point in the market in tandem with the breakout to get going in a positive trend. However, while steeping in a short-term trade, the traders must be cautious and must, in all cases, anticipate a possibility of retracement to the demand zone.
- Supply and demand zones as risk management parameters: Since the supply and demand zones function like support and resistance, they are good indicators of stopping and limiting. Therefore, it becomes possible for the traders to play safe, thereby maintaining a favorable ratio of risk and rewards in all cases. For example, for range traders who plan to sell at the supply zone, stopping above the supply zone and the targets near the demand zone is best. Further, conservative traders should place the target above the demand zone. Along with this, numerous other risk management techniques can be used to experience safe trading.
The best supply and demand Forex strategy
The best supply and demand forex strategy must follow the primary overall daily trend, economic news. The best performance you can get using this free supply and demand forex indicator and financial information on more oversized time frames such as daily, weekly, and monthly charts.
Therefore, supply and demand trading can be beneficial for numerous reasons. Once you master the basic concepts of supply and demand and how they impact the foreign exchange market, having a positive risk and reward ratio will become extremely easy.
Supply and demand are the primary influencers of the markets. Whether it’s a commodity market, securities market, or Forex market, supply and demand are always considered to make the correct predictions for trading.
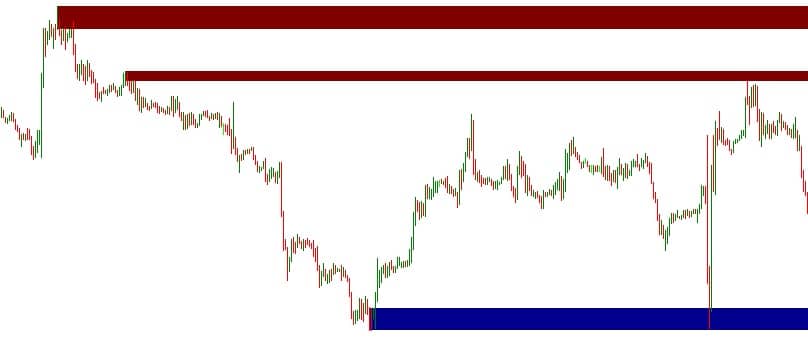
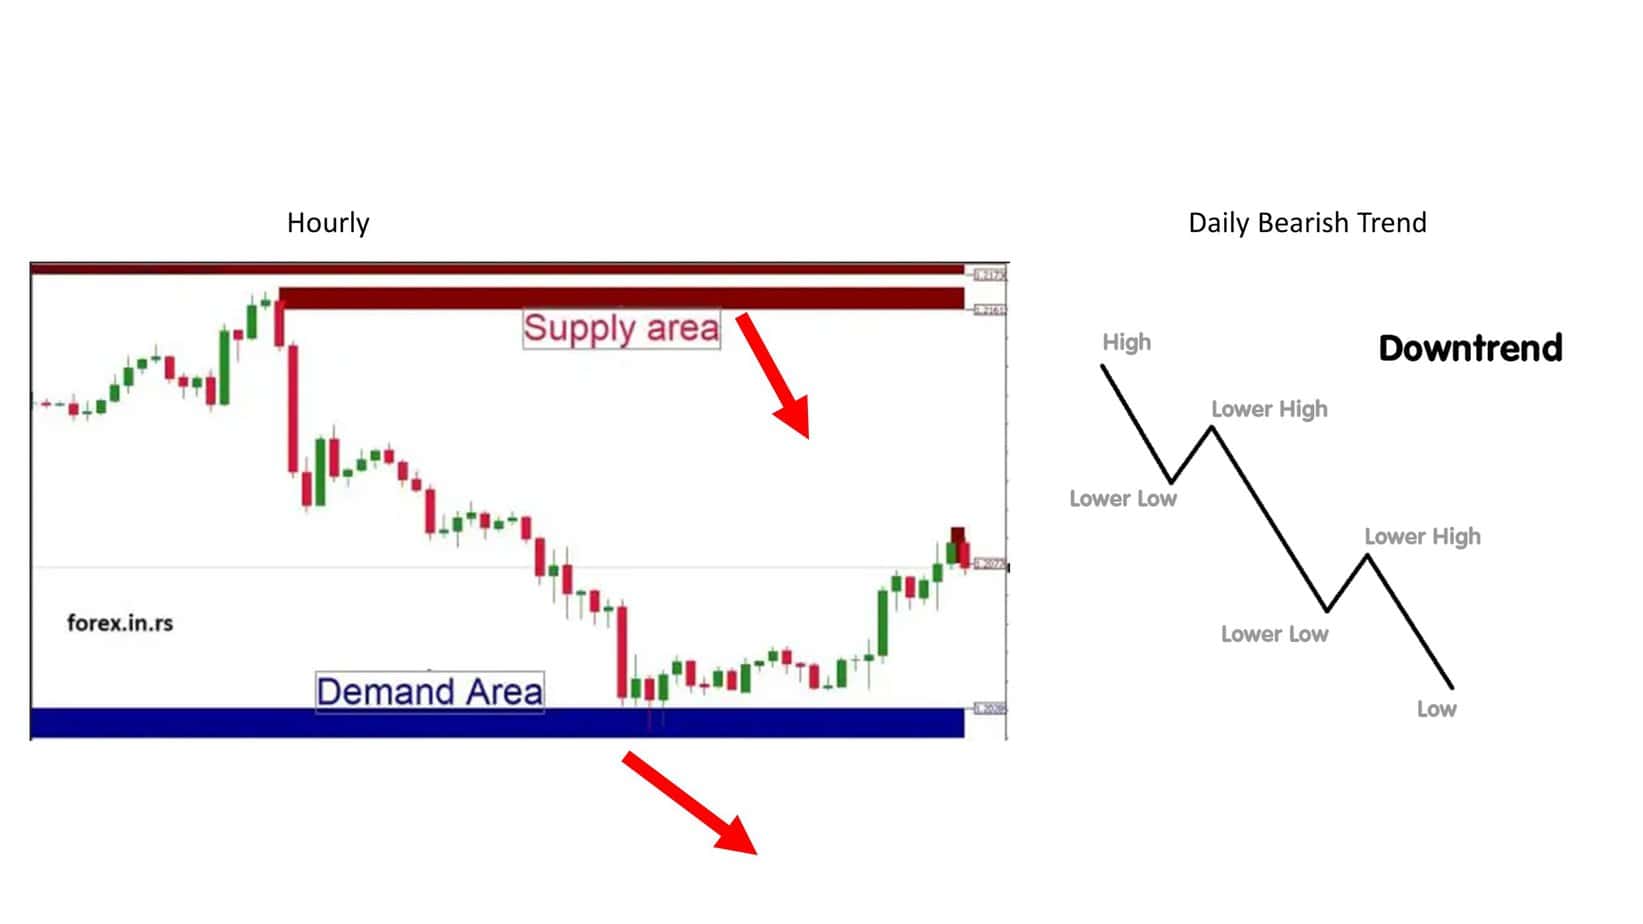
A rectangle at the top and bottom of the price chart generally represents supply and demand in the Forex market. These rectangles indicate the intense reversal in the movement of the price. The rectangle at the upper side is the supply zone. This supply zone shows that a downward trend is approaching. Similarly, the bottom rectangle indicates a demand zone that displays the upcoming upward trend.
These zones are highly beneficial for the traders. The traders do not need to draw them repeatedly on the price charts by using them. Instead, they can look at the historical patterns and follow the path.
Conclusion
Almost everyone who is trading, a beginner or a pro, understands the concept of demand and supply. These two concepts are applicable even beyond trading. New traders find using demand and supply zones easier than the resistance and support levels. This is mainly because of the accuracy of these zones and their indicators.
Before you begin trading, do thorough research and start small.

He is an expert in financial niche, long-term trading, and weekly technical levels.
The primary field of Igor's research is the application of machine learning in algorithmic trading.
Education: Computer Engineering and Ph.D. in machine learning.
Igor regularly publishes trading-related videos on the Fxigor Youtube channel.
To contact Igor write on:
igor@forex.in.rs
