Table of Contents
Traders widely use Fibonacci levels in the forex market as a technical analysis tool to identify potential support and resistance levels. These levels are derived from the Fibonacci sequence, a series of numbers where each is the sum of the two preceding ones, starting from 0 to 1. In trading, key Fibonacci ratios like 23.6%, 38.2%, 50%, 61.8%, and 100% are applied to identify significant price levels on charts.
Traders use these Fibonacci levels to predict future price movements, often in conjunction with other technical indicators and chart patterns. Applying Fibonacci levels in forex trading helps traders make more informed decisions regarding entry and exit points, stop-loss orders, and target prices.
What is the Fibonacci Golden Zone?
Fibonacci Golden Zone represents a specific area on a trading price chart, defined by the 61.8% and 50% Fibonacci retracement levels. This zone is considered significant for identifying potential supply or demand zones, where short-term reversal usually ends while the primary trend continues.


Please see the chart below:


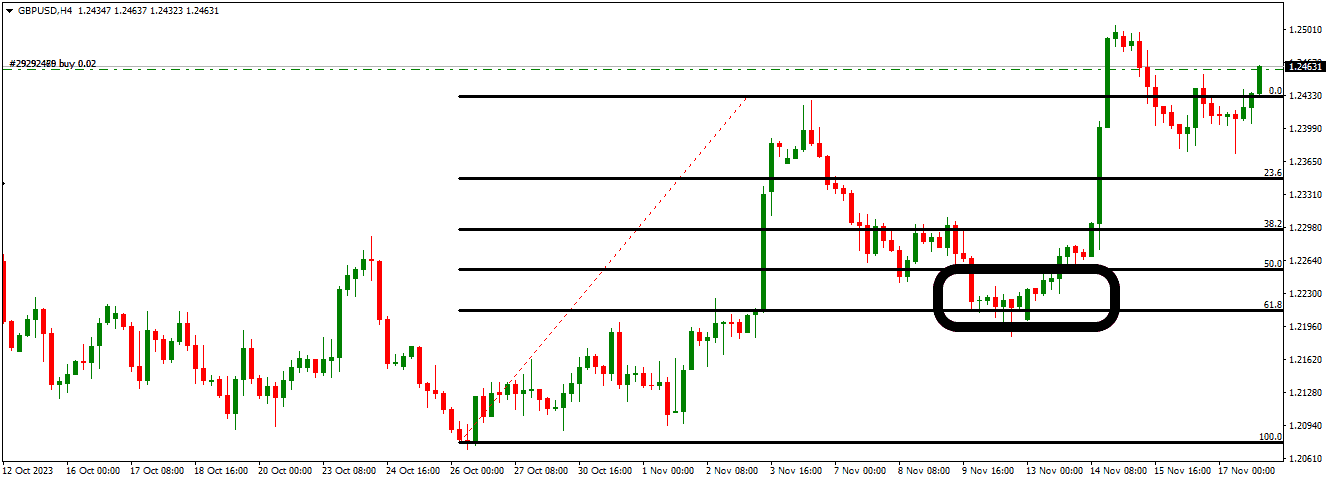
As we can see on the chart, the price went from 1.208 up to 1.2433 in the first week of November. After that, the price made a bearish short-time trend reversal up to 61.8% Fib retracement on 1.22. After this move, the price continued a bullish trend up to 1.2We were using Fib. Retracement: we can predict the reversal point on the chart using the Fibonacci Golden Zone.
The Fib Golden Zone is a powerful tool in technical analysis, particularly in forex trading, to predict potential reversal points in price trends. Let’s break down your example to understand how it applies:
- Initial Price Movement: The price moved from 1.208 to 1.2433 in the first week of November. This upward movement forms the basis for applying Fibonacci retracement levels. In Fibonacci analysis, this initial move is considered a trend, and retracement levels are drawn to identify potential reversal points.
- Drawing Fibonacci Retracement Levels: To apply Fibonacci retracement, we identify this move’s significant low (1.208) and high (1.2433). The Fibonacci retracement tool is then used to draw levels between these two points. The most commonly watched retracement levels are 23.6%, 38.2%, 50%, 61.8%, and 100%.
- The Golden Zone: Among these levels, the area between the 61.8% and 50% retracement levels is particularly significant and is referred to as the Fibonacci Golden Zone. In my example, the price retraced to the 61.8% level, which is at approximately 1.22. Traders closely watch this zone as it often acts as a strong support (in an uptrend) or resistance (in a downtrend) level.
- Predicting Reversals with the Golden Zone: When the price retraces to the Fibonacci Golden Zone and then shows signs of resuming the initial trend, traders often consider this a confirmation of the trend’s strength. In your case, after reaching the 61.8% retracement level, the price resumed its bullish trend, which could have been anticipated as a potential outcome.
- Continuation of Trend: Following the touch of the 61.8% level, the price continued its bullish trend, eventually reaching 1.25. This movement confirms the utility of the Fibonacci Golden Zone in identifying potential reversal points and the continuation of the original trend.
In summary, in this scenario, the Fibonacci Golden Zone is a critical area to watch for a potential reversal in the short-term bearish trend and a resumption of the initial bullish trend. Traders utilizing this method would have observed the price behavior around the 61.8% retracement level for signs of trend continuation and, in this case, could have capitalized on the subsequent bullish movement.

Fibonacci Golden Zone Calculation
The Fibonacci Golden Ratio, often represented as 0.618 or 61.8%, is intimately connected to the Golden Ratio, a fundamental concept in mathematics and art. To understand its calculation and significance, let’s delve into both the Fibonacci sequence and the Golden Ratio:
Fibonacci Sequence:
- Definition: The Fibonacci sequence is a series of numbers where each number is the sum of the two preceding ones, usually starting with 0 and 1. So, it goes 0, 1, 1, 2, 3, 5, 8, 13, 21, 34, and so forth.
- Fibonacci Ratios: As the sequence progresses, the ratio of a number to its immediate predecessor approaches a constant value. For instance, 21/13 ? 1.615, 34/21 ? 1.619, and this ratio converges to a value as you go higher in the sequence.
Golden Ratio:
- Mathematical Concept: The Golden Ratio, often denoted by the Greek letter phi (?), is approximately equal to 1.618. It has been known and used for centuries and is often found in nature, architecture, and art.
- Calculation: Mathematically, the Golden Ratio is derived when a line is divided into two parts so that the total length divided by the longer part equals the longer part divided by the shorter part. This ratio is always approximately 1.618.
Connection between Fibonacci and the Golden Ratio:
- Fibonacci Convergence to Golden Ratio: As mentioned, as you progress in the Fibonacci sequence, the ratio of a number to its predecessor approaches the Golden Ratio. This is true for the ratio of a number to its immediate predecessor (which approaches ?) and to its second predecessor (which approaches 1/? or about 0.618).
- Fibonacci Golden Ratio (0.618): If you take any number in the Fibonacci sequence and divide it by the number two places to the right, you get approximately 0.618. For example, 13/21 ? 0.619, 21/34 ? 0.618. This ratio of 0.618 is often referred to as the Fibonacci Golden Ratio in trading and technical analysis.
Application in Trading:
- Fibonacci Retracement Levels: In trading, Fibonacci retracement levels predict potential support and resistance. The critical retracement levels are derived from these Fibonacci ratios, particularly the 61.8% level, essentially the Fibonacci Golden Ratio. It is significant because it represents a potential reversal point according to the natural order and patterns observed in the Fibonacci sequence.
- Why 61.8% Is Important: 61.8% is so important in trading because it is believed to reflect a natural balance point. The idea is that markets often retrace about 61.8% of a significant move before continuing the trend, aligning with the natural order and patterns observed in the Fibonacci sequence and the Golden Ratio.
The Fibonacci Golden Ratio in trading (61.8%) is derived from the mathematical properties of the Fibonacci sequence and its relationship to the Golden Ratio (? ? 1.618). This ratio is significant in technical analysis as it is believed to represent a natural balance point in market movements, offering insights into potential reversal points in price trends.

He is an expert in financial niche, long-term trading, and weekly technical levels.
The primary field of Igor's research is the application of machine learning in algorithmic trading.
Education: Computer Engineering and Ph.D. in machine learning.
Igor regularly publishes trading-related videos on the Fxigor Youtube channel.
To contact Igor write on:
igor@forex.in.rs
Related posts:
- Fibonacci Retracement Trading Strategy! – Golden Ratio Strategy!
- Fibonacci 88.6% Level – Important Fibonacci Retracement Levels
- Fibonacci Expansion Levels – Download Auto Fibonacci Extension Indicator MT4
- What is The Supply Zone?
- What is Demand Zone?
- What is Liquidity Zone in Forex?
- How to Predict Forex Movement? – Practical Example
- What is XM Broker Time Zone?
- How to Get a Job at a Trading Firm? – Practical Example
- How to Choose Forex Broker? – 17 Practical Steps
- Where is Fibonacci Indicator in HF Markets Platform?
- Best MACD Settings for Intraday Trading
