Understanding market dynamics, such as supply and demand, is essential for predicting price movements. The concept of supply and demand zones is rooted in the basic economic principle that when an item’s an abundance (or supply), its value decreases, and when there’s scarcity (or demand) for an item, its value increases.
What is The Supply Zone?
The supply zone represents the high liquidity price levels area on the trading chart where the volume of selling trades significantly exceeded buying trades. Usually, in the supply price zone, most traders close buy orders or make new sell orders.
Let us explain supply zone in a practical example:


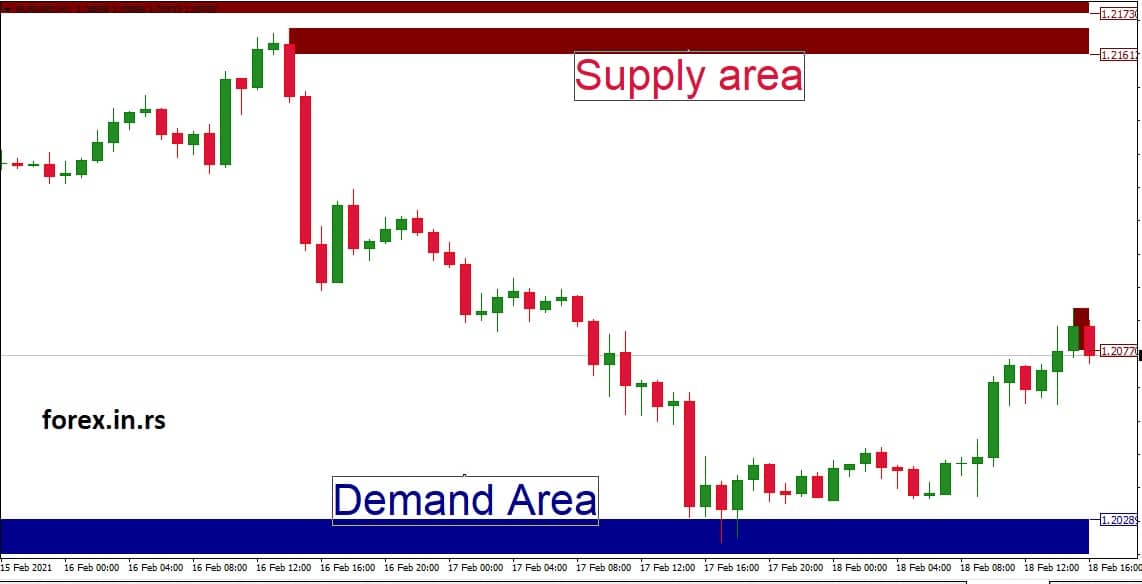


Above is the presented supply zone area.
While examining the GBP/USD hourly chart, you’ve pinpointed a distinct pattern around a specific price zone. The currency pair has shown significant resistance and a propensity to decline when it reaches a region between 1.2161 and 1.2173.
- Identification of the Zone: Over the past several weeks, every time the price has ventured into the 1.2161 to 1.2173 area, it has faced significant selling pressure, causing it to retreat. This recurrent behavior indicates that this is a supply zone.
- Volume and Price Action: On closer inspection, whenever the price reaches this zone, you observe larger bearish candles, possibly signifying aggressive selling—additionally, trading volume spikes, revealing heightened activity predominantly on the selling side.
- Market Sentiment: Delving more profound, you discover that there might be various reasons for this resistance. It could be tied to economic data releases that reflect a stronger USD or weaker GBP, geopolitical tensions, or even technical traders recognizing this level and acting on it. The confluence of these factors strengthens the credibility of the 1.2161 to 1.2173 region as a supply zone.
- Trading Strategy: Given this analysis, a prudent trading strategy might be to monitor the price as it approaches this zone again. If there are bearish reversal patterns (like shooting stars or engulfing patterns) around this zone, one might consider entering a short position, anticipating a drop. Setting a stop loss slightly above, say around 1.2180, could be wise to protect against potential losses if the price breaks through the supply zone.
- Outcome: On the following approach to this zone, the price touches 1.2167 within the range and soon shows bearish signs. Acting on these cues and the established supply zone, traders taking a short position can benefit from the subsequent price decline.
This example showcases the value of recognizing and understanding supply zones on forex charts. By acting on such insights and combining them with other technical indicators, traders can make more informed decisions in the market.
The supply zone in Forex refers to an area on the chart where selling interest has significantly exceeded buying pressure. This typically results in a price decline. Traders can use these zones to identify potential areas where the price might face resistance and start to drop.

Here’s a detailed breakdown of the supply zone:
- Origination Point: The supply zone often starts after a noticeable price drop. This drop signifies a strong presence of sellers or a lack of buyers at that price level.
- Historical Relevance: If the price has returned to this level multiple times and has been repelled downwards, this strengthens the credibility of the supply zone. It shows that sellers consistently outweigh buyers at this price point.
- Appearance on the Chart: A supply zone usually appears as a consolidation area followed by a sharp drop. This drop represents a surge in selling activity.
- Usage for Traders: Forex traders use these supply zones to position themselves for potential selling opportunities. When the price re-enters a supply zone, it is more likely that the price might reverse and move downwards, making it a good area for traders to consider opening short positions.
- Risk Management: It’s crucial for traders to use supply zones in conjunction with other technical analysis tools and to employ sound risk management techniques. Just because a price enters a supply zone doesn’t guarantee a drop. There are instances where prices might break through the zone and continue rising.
Now, from this point, you need to learn two major things :
Please read our articles to learn more.
Conclusion
Supply zones are instrumental tools in the arsenal of forex traders. These zones, representing areas on a chart where selling interest historically outweighs buying pressure, offer traders invaluable insights into potential future price movements. By identifying and observing these zones, traders can anticipate potential resistance areas, enabling them to make strategic decisions such as entering short positions or setting protective stop-loss orders.
The underlying principle of supply zones revolves around the fundamental economic concept of supply and demand; when there’s an overabundance of supply (sellers) at a particular price level, prices tend to decline. By leveraging this knowledge, traders can better navigate the volatile waters of the forex market, capitalizing on opportunities and mitigating risks. Understanding and effectively utilizing supply zones is a testament to the art and science of trading.

He is an expert in financial niche, long-term trading, and weekly technical levels.
The primary field of Igor's research is the application of machine learning in algorithmic trading.
Education: Computer Engineering and Ph.D. in machine learning.
Igor regularly publishes trading-related videos on the Fxigor Youtube channel.
To contact Igor write on:
igor@forex.in.rs
