Table of Contents
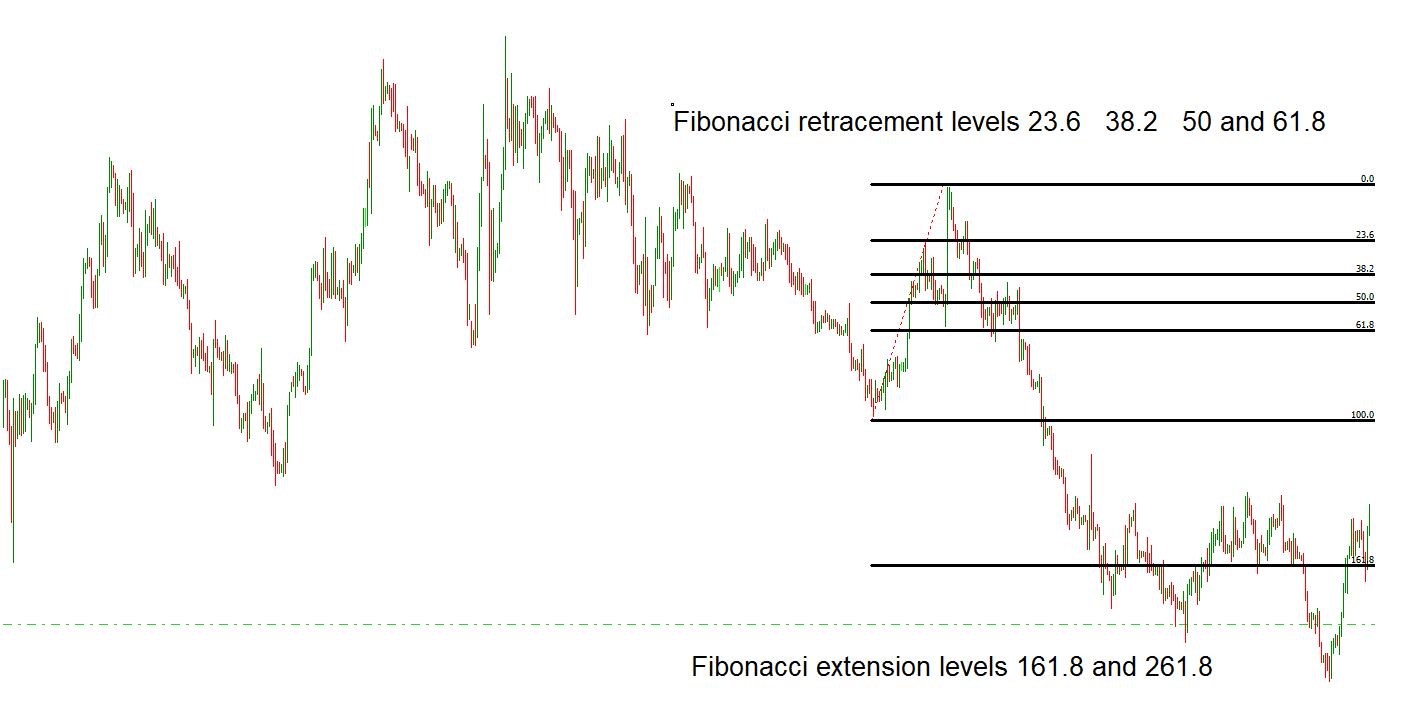
Fibonacci retracement levels are horizontal lines on a trading chart that indicate where possible future price support and price resistance levels are likely to occur. Fibonacci retracement levels exist only between past low and past high price zones. But can we draw Fibonacci levels above the previous high and below the previous low?
What are Fibonacci Expansion Levels?
Fibonacci Expansion Levels or Fibonacci extension levels are technical analysis lines, calculated as the percentage between high and low prices, which can be drawn above the highest or below the lowest low price level. The most common Fibonacci Expansion levels are 161.8%, 200%, and 261.8%. Fibonacci projection levels are the second name for Fibonacci expansion levels because price levels go beyond 100%.


Fibonacci Expansion Levels or extension levels follow the same logic as Fibonacci retracements. The Metatrader platform has fib extension and fib retracement (standard) indicators, and it draws automatic lines on the chart after the user picks high and low levels.
The most common levels for Fibonacci retracements are 23.6%, 38.2%, and 61.8%.


Fibonacci extension levels facts:
- Fibonacci ratios are derived from the Fibonacci sequence and are seen universally in varied natural elements.
- Fibonacci extension levels show the extension of a trend move.
- Fibonacci extension levels are 161.8%, 200%, 261.8%, etc.
- Fibonacci extension levels show how far the next price above 100% wave could move.
- Extension levels are just important hypothetical levels; price is not guaranteed to react to them.
Let us see what the best Fibonacci expansion levels are:
What are Important Fibonacci extension levels?
For traders, the most critical Fibonacci extension levels are 161.8%, 200%, and 261.8%. These three levels can help traders determine target levels in a bull or bear market when the price is very close to the high or low. In that case, important Fibonacci expansion levels are the best for predicting the next high (bullish trend) or low (bearish trend).

Download Auto Fibonacci Extension Indicator MT4
Auto Fibonacci Extension Indicator MT4 represents an indicator that draws retracement levels and expansion levels in an automated way on the MT4. Below, you can download the Fibo levels indicator:
Please.
In this indicator are added Fibonacci expansion levels using code:
double level_array[10]={0,0.236,0.382,0.5,0.618,0.764,1,1.618,2.618,4.236};
string leveldesc_array[13]={“0″,”23.6%”,”38.2%”,”50%”,”61.8%”,”76.4%”,”100%”,”161.8%”,”261.80%”,”423.6%”};
int level_count;
string level_name;
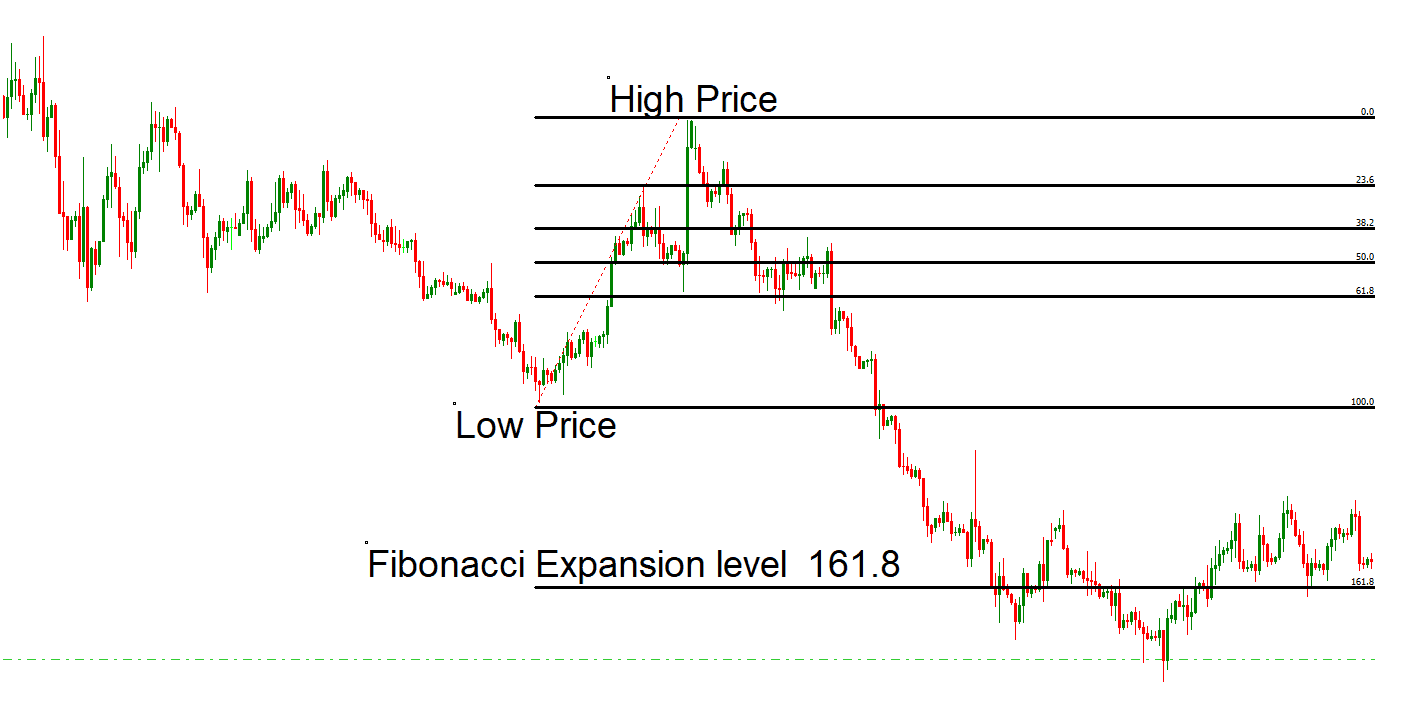
The indicator will automatically draw only levels seen on the chart. If the price level is too far, it will not be visible. For example, the chart below shows only 161.8% expansion Fib. Levels 261.8% and 423.6% are not visible because they are too far.
Download Auto Fibonacci Indicator MT4
If you need an automated indicator that will draw Fibonacci levels automatically based on the latest number of periods, then you can download it below:
Download Auto Fibonacci Indicator MT4
Technical traders rely extensively on the Fibonacci Retracement tool to scour the market for opportunities and rake in gains from the trading market. This tool is easy to use as its foundation is based on the Fibonacci number sequence like 0,1,1,2,3,5,8, etc. Once you divide these Fibonacci numbers with adjacent numbers, you will acquire a Fibonacci ratio to help you further in the technical trading strategy.
The first step to plotting this indicator in the chart is to locate the high and low points, which often pose some errors for traders. You can also encounter blunders when using this indicator, but it will be a breeze once you become more proficient. However, if you want to speed things up, the Auto Fibonacci Retracement tool is a viable choice, as it takes away the burden of finding the highs and lows and does the plotting for you. The most versatile quality of the Auto Fibonacci Indicator is that you can use it in different time frames and currency pairs.
How do you use the Auto Fibonacci Retracement Indicator?
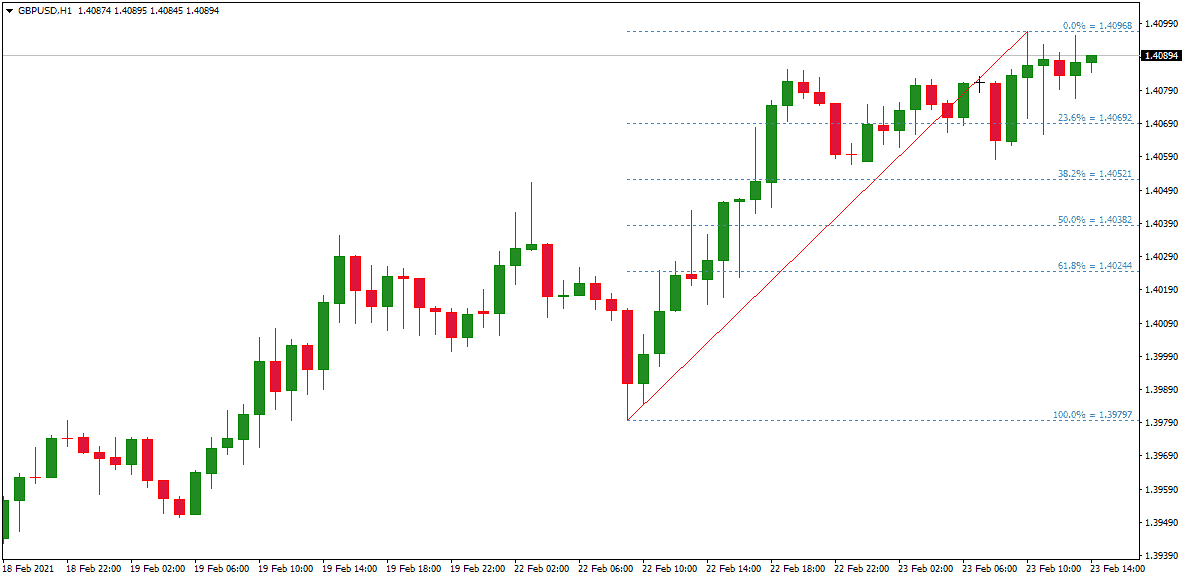
To use the Auto Fibonacci Retracement indicator, you just need to drag and drop it into the MT4 platform and mark the desired lowest and highest price levels on the chart. The indicator will then mark all retracement lines between high and low prices on the chart and expansion levels above and below the chosen high and low prices.
The levels in this indicator range from 0 to 100%. If the market is currently bearish, the 0 points will be at the peak while the 100 lies below. The opposite happens when the market is bullish. Once the market jumps to a new high, it will retrace different Fibonacci Retracement Levels.
To comprehend the above part, let’s take an example of an uptrend that retraces up to the 38.2% Fibonacci level. Now, you will monitor the market until it returns to the 38.2% level and then take a buy position. Then, your stop-loss point will come below the 50% Fibonacci level. Finally, the take profit point can be established at the following high resistance level to know the ideal exit points.
This price will also increase to 50% in some instances. Traders highly praise the level of 61.8% as it gives excellent pullback opportunities. You can also trade on the 78.6% level on the Fibonacci Retracement tool, as it makes up for a good reversal point, but traders often ignore it.
You can also utilize the Fibonacci Retracement levels for take-profit and continue with the trend wave. For instance, if the uptrend in the market is retracing, you can acquire a short position with a profit point of 68.1%.
If you observe a chart depicting the price motion of the U.S. dollar in opposition to the Japanese Yen in the half-hour timeframe, the retracement point goes beyond the levels of 38.6% and 50%. You will witness a pullback from 61.8% to 38.6% before continuing the bullish trend in the market.
Based on your technical strategy, you will enter the trading market with your stop loss point above the most recent high swing. If you want to exit a trade, do so at the 78.6% or 100% Fibonacci level, which collides with the following support zone. Traders also utilize the Fibonacci expansion tool to profit from the market.
This Auto Fibonacci Retracement Tool cuts off the time-consuming plotting process and makes it easier to trade with its automated functions. However, the level is not an indicator of the exit and entry signals; it is the Fibonacci levels. Hence, just like any other technical trading tool, using this indicator with a blend of different tools would be prudent.
Download Fibonacci EA – EA Fibonacci MQ4
We can quickly create a Fibonacci Expert Advisor using an automated Fibonacci indicator. Below, you can download for free Fibonacci Ea.
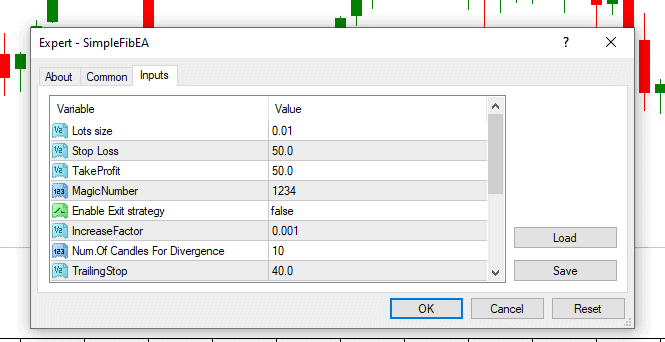
Please download EA Fibonacci MQ4
Main Facts about Fibonacci Expansion (Extension) levels and Fibonacci retracements
Regarding technical analysis, the term that refers to any area of resistance or support is known as a Fibonacci retracement. It will also use a horizontal line to point where there might be resistance or support, and each of those levels will be labeled using percentages. That percentage amount is a pricing amount that has moved and been retraced. The levels within Fibonacci retracements are 78.6%, 61.8%, 38.2%, and 23.6%, while even though it may not be official, 50% can be used.
Fibonacci extension levels
The Fibonacci extensions show how far the next price wave could move above 100%. Common Fibonacci extension levels are 161.8%, 200%, 261.8% and 423.6%.
This is considered beneficial due to its ability to show highs and lows between different price points, creating a known level between the selected points.
For instance, if the price started at $10 and suddenly dropped to $3.82, it has done a retrace, which is a retraced 38.2%, a number of the Fibonacci retracement. These particular sets of numbers can be found everywhere, so these specific numbers are believed to be relevant within the financial market.
Formula Used to Find the Fibonacci Expansion (Extension) and Retracement Levels
An indicator does not have a formula, so when a trader applies an indicator to charts and picks two points, the lines drawn will show the moving percentage once the points are selected.
For instance, if a price goes from $15 to $20, and the two prices have been selected to find the indicator, multiply the amount difference between the two prices by the Fibonacci Retracement percentages to find the levels. Therefore, you would take $20 – ($5 X 0.5) = $17.50,.
If a trader wanted to calculate the levels, you would follow the formula listed above and use the percentage of a particular price range that has been selected.
However, many ask where these particular sets of numbers originate from. They are all based on what is known as the Golden Ratio.
If a person created a specific number sequence that began with zero, added one, and continuously added the first two numbers, this string would continue indefinitely. For instance, it would look something like this:
0+1 = 1, 1+1=2, 1+2 = 3, 3+2 = 5, 5+3=8, 8+5 =13, 13+8=21, 21+13 = 34, 34+21=55, 55+34=89, and it would continue on just like this. The sums would make up the entire string of numbers indefinitely.
All of the levels are going to come from this series of numbers. However, this excludes the first very few numbers, so when the series is going, if the number is divided by the number that comes next, you will end up with the level numbers. However, taking time to explore these options carefully, a person would notice that all of these percentages, except for 50%, will be considered an actual Fibonacci number as 50% is not seen as an official percentage. These percentages will be based on math calculations based on this particular number string.
Another exciting thing about the Golden Ratio is that 1.618 or 0.618 can be located within galaxy formations, historical architecture, artifacts, shells, and even sunflowers.
The Fibonacci retracements can determine stop-loss levels, help set target prices, and place entry orders. If a trader notices that a stock is moving up and after it moves, it ends up with a 61.8% retrace, then it begins to bounce again. Because the bounce was considered at a level on the Fibonacci scale, and if the trend stays long, a trader may decide to buy. A trader could create a stop loss within 78.6% or 100% of where it originally started.
These levels can also be utilized in various types of technical analysis. For instance, they are seen in the Elliott Wave theory and Gartley patterns. After a price has moved down or up significantly, it always seems to do when a price starts to retrace its path; these analyses will find the retrace and notice that it reverses to certain levels.
Unlike a moving average, these levels are often at a fixed price that will not usually change. A static nature will be needed to efficiently and quickly identify price levels. This allows investors and traders to react and anticipate when a level may be tested. The levels will often be an inflection point, indicating where a price action could be expected, whether a break or a rejection.
How do you use the Fibonacci extension on MT4?
To use the Fibonacci extension on MT4, choose Insert/Fibonacci/Expansion tool and select the highest and lowest prices on the chart. At that moment, Fib levels will be added to the chart (see image below):
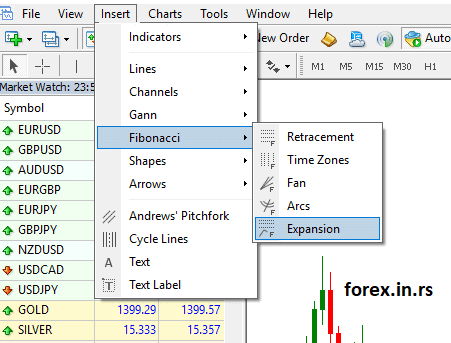
If you pick Fib, levels retracements, or Expansion levels, you will get expansion levels in both cases. However, the expansion levels tool will give you only the two most common levels for your target.
How do you trade with Fibonacci retracements and extensions?
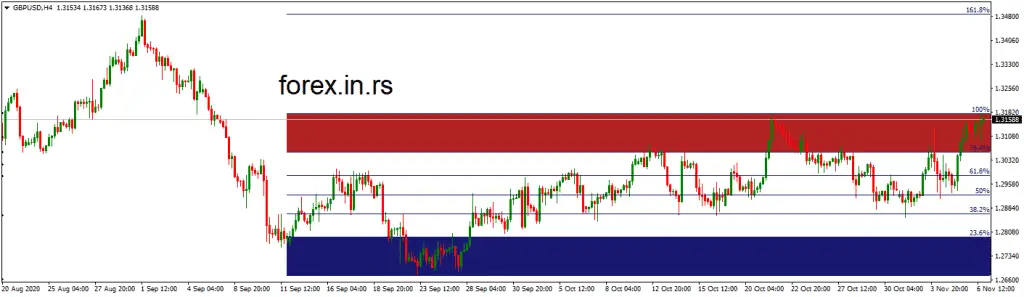
We must define the entry and exit strategy after drawing Fib levels on the chart (retracements and extensions). Fib. We can use these levels as exit and entry levels. Example :
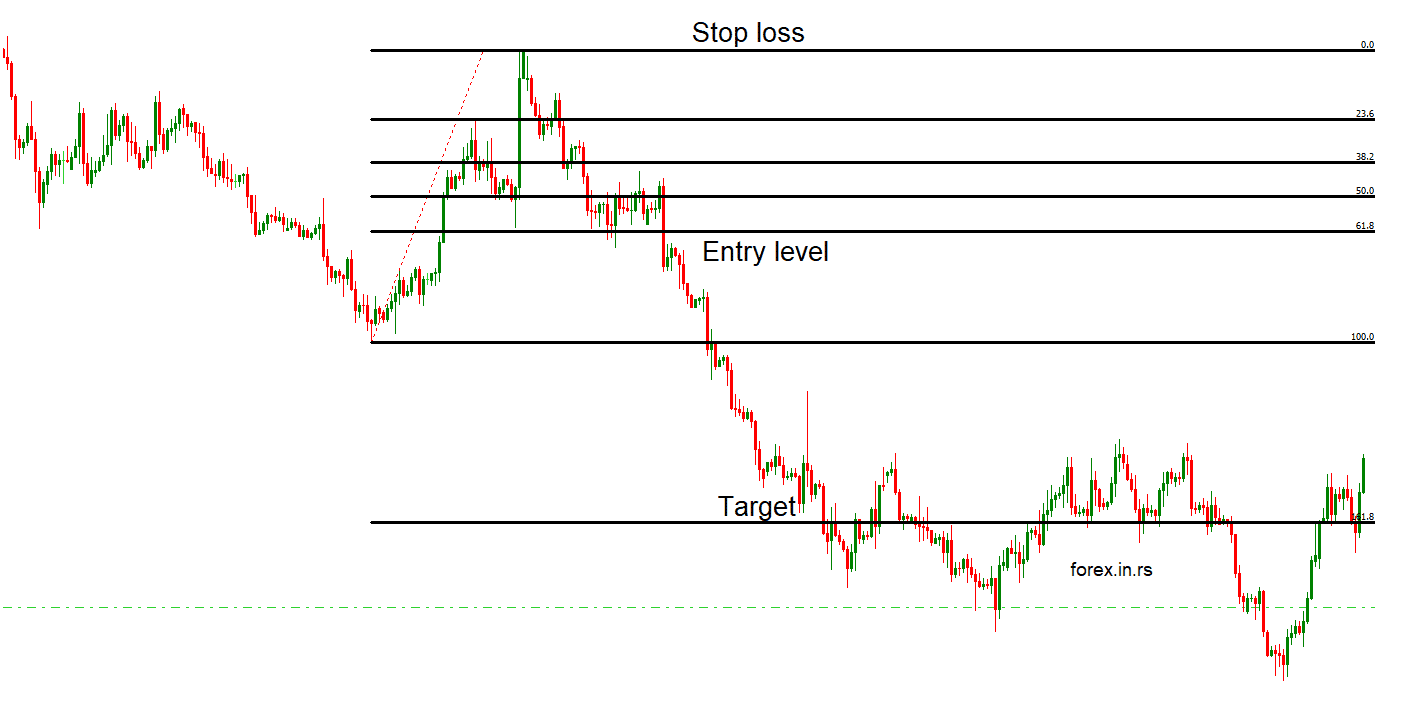
So your strategy can be for SELL TRADE :
Step 1: Pick low and high on the chart.
Step 2: If the close hourly price is below 61.8% Fibonacci retracement, make a SELL trade.
Step 3: Put stop loss on High Price.
Step 4: Set your target to be either 161.8% expansion level, 20,0% expansion level, or 268.1% expansion level.
You can cut a small number of lots on each target and move stop loss, whatever you like.
See this strategy for sell trade in the image below:
Differences Between Expansions (Extensions) and Retracements levels
The Fibonacci extensions are the percentages that return to a trending direction, while the retracements are the percentages that pull back. So, for instance, if you have a stock that increases from $5 to $10 but then goes back down to $6.75, then it is considered to be a retracement, but if that price happens to increase up to $16, then it is called an extension.
Level Limitations
Even though retracement levels can show where a price may potentially find resistance or support, there are no assurances that this special price will stop at that point. This is why a trader should look for other signals that may be utilized, such as prices bouncing off a particular level.
Another argument against a retracement level is that, due to several levels, the price could reverse near one of these levels, which can happen much more often than it would not. The problem is that a trader could struggle to locate which one would be helpful during any retracement that may be happening and analyzed.
The Key Takeaways
An indicator connects two points a trader will view as relevant, often a low and a high. Once an indicator has been selected and drawn on the chart, these levels will be considered fixed and will not change. The provided percentages will be locations where pricing may reverse or stall. Therefore, a trader should not solely rely on the levels. For instance, assuming that a price will reverse after hitting a particular Fibonacci level is detrimental. It could, but then it may not.
A Fibonacci retracement level can show areas of interest that may offer potential. For example, if traders are looking to buy, they will watch if the price stalls at a Fibonacci level and wait for it to bounce off that particular level before deciding to buy.
The most commonly used ratios are 78.6%, 61.8%, 38.2%, and 23.6%, while 50% is seen as an unofficial retracement level. These percentages show how much of a previous move was made, whether retracted or corrected.
The determination of support and resistance levels is the most essential part of technical analysis. Therefore, pivot points are a significant indicator of market price trends. The Fibonacci Pivots Indicator is a helpful indicator that helps determine the stop loss and take profit point.

He is an expert in financial niche, long-term trading, and weekly technical levels.
The primary field of Igor's research is the application of machine learning in algorithmic trading.
Education: Computer Engineering and Ph.D. in machine learning.
Igor regularly publishes trading-related videos on the Fxigor Youtube channel.
To contact Igor write on:
igor@forex.in.rs
