Fibonacci levels are commonly used in trading to identify essential price points and potential areas of support or resistance. These levels are derived from the Fibonacci sequence, a series of numbers in which each is the sum of the previous two numbers.
I know this level is not famous in trading, but sometimes it can surprise traders. Usually, traders think that from 61.8% up to 100%, there is no critical level.
Remember, several different Fibonacci levels can be helpful for traders, including the 88.6% level, representing the price level derived from the golden ratio.


When trading with Fibonacci levels, it’s important to keep an eye on these key price points and monitor for any potential reactions at these levels. When prices reach one of these key levels, there may be a strong buying or selling opportunity, depending on whether prices have been trending up or down before reaching that level.
All Fibonacci Retracement levels are 23.6%, 38.2%, 50%, 61.8%, 78.6%, and 100%, while expansion levels are 161.8%, 261.8%, and 423.6%. Additionally, some traders use Fibonacci levels derived from the golden ratio, such as 88.6% and 94.1%.
Overall, Fibonacci levels are an important tool for traders to use in their analysis and decision-making process when entering and exiting trades. By understanding how these price points work and reacting appropriately to them during trading, traders can potentially generate better returns over time by taking advantage of these key price points in their trade markets.

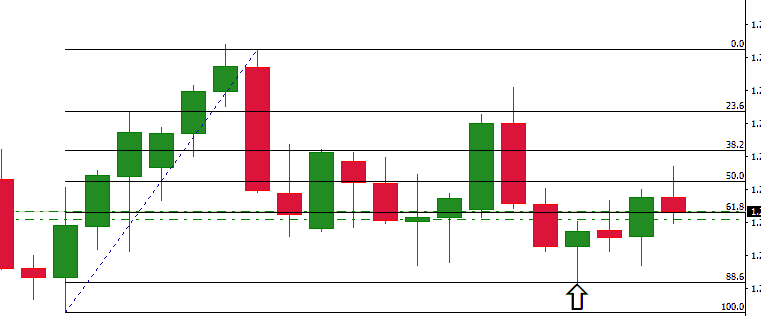
In theory, fib. Extreme retracement after 88.6 is not a critical level. However, based on several case studies, the price oscillates around 88.6 to 100% Fib-retracement very often before rejection or breakout moment.
Is 88.6% fibonacci retracement level?
88.6 Fib. The level represents the price level derived from the golden ratio (0.618 x 0.618 = 0.786, 0.786 x 0.786 = 0.886 88.6%). Fibonacci Retracement Levels of 88.6% and 78.6% can be necessary in some cases, so traders need to monitor these levels and check if there are price reactions in this area. The best practice is to draw Fib. Retracement and Fibonacci expansion levels and analyze all price levels during the trading.
88.6% price level is derived by squaring (or multiplying by itself) from the Golden Ratio, 0.618:
0.618 x 0.618 = 0.786 (78.6%)
0.786 x 0.786 = 0.886 (88.6%)
0.886 x 0.886 = 0.941 (94.1%)
Learn more, in detail, articles about Fibonacci expansion levels.
The 88.6% Fibonacci level is derived from the “Golden Ratio” and has been adopted by some traders as an important potential support or resistance level in technical analysis. Let’s delve into the details:
- The Golden Ratio and Fibonacci Numbers:
- The Golden Ratio, often represented by the Greek letter Phi (?), is approximately equal to 1.6180339887. It’s a unique number with several interesting properties and appears frequently in nature, art, and architecture.
- Fibonacci sequence is a series of numbers where each number is the sum of the two preceding ones, typically starting with 0 and 1. The sequence goes 0, 1, 1, 2, 3, 5, 8, 13, 21, etc.
- As we progress along the Fibonacci sequence and take the ratio of sequential numbers, we approach the Golden Ratio. For instance, 21/13 = 1.6153 and 34/21 = 1.6190.
- Fibonacci Retracement Levels:
- Traders use the Fibonacci sequence to derive particular percentages termed “retracement levels.” These levels represent potential areas where a financial instrument (like a stock or currency) might find support or resistance.
- The standard Fibonacci retracement levels include 23.6%, 38.2%, 50%, 61.8%. These are derived from the mathematical properties and relationships within the Fibonacci sequence.
- The 88.6% Level:
- The 88.6% Fibonacci retracement level is not directly derived from the Fibonacci sequence like the other expected retracement levels. Instead, it is based on the square root of the Golden Ratio.
- Mathematically,
. But when we subtract this value from 1, we get 1 – 0.786 = 0.214. When this is viewed as a percentage, it becomes 21.4%, which means the price has retraced 21.4% of its prior move. This is the opposite side of the 78.6% retracement. To get the 88.6% retracement level, we use the square root of 0.786, approximately 0.886 or 88.6%.
- Some traders believe the 88.6% level is the last retracement before reversing, making it critical to watch.
- Usage in Trading:
- Fibonacci levels, including the 88.6% level, are used as a tool among many in a trader’s toolkit. They can serve as potential areas of support or resistance.
- When a price retraces to one of these levels and then shows signs of resuming its prior trend, traders might consider it a potential buying or selling opportunity, depending on the context.
- Like all trading tools, Fibonacci levels are most effective with other indicators and methods.
Tips for Using the Minimum 88.6% Retracement with Fibonacci Pattern in Forex Trading
When you seek Fibonacci trading, there are three main patterns:
1. Using multiple setbacks and extensions to identify price levels in different Fibonacci levels that overlap to produce “clusters.”
2. The use of multiple indicators like MACD in different Fibonacci levels.
3. Fibonacci levels are used as part of a larger graphic pattern, like in the “head and shoulders” pattern.

Here, you would find information on a specific Fibonacci level focusing on trade and mostly in seclusion. It is a decline of 88.6%. This level was reached for summarization after using 0.618, the Golden Ratio, the square root, and the square to achieve 0886.

When it is exclaimed that it is achieved by making Fibonacci retracement, it means the retracement to 88.6% tells the range of the original characters. Therefore, the grains would decline if the starting step involved 100 pips up, retracing to 88.6. The unique thing about Fibonacci levels is that they are not influenced by a specific time. They feature the same importance as wanted in a weekly long-term chart or have a five-minute graphic.
The first price achieved a high Point X 1.1967 on 8th March 2009. Then, it reached .9909 on the Y-Point on 22nd November 2009. Therefore, the price came down to 2058 points in 37 weeks. The Z price point reached 1.1730 on 30th May 2010, 28 weeks post Y point. When the figures and diagrams were examined, they were at 2 points, with the retracement level at 88.6%. This is unbelievable, as the price was up thousands of points for many weeks already, precisely matching the primary Fibonacci levels.
When this level is identified, you will find a spotless hit giving a trader over 1000 pips when the trader chooses to stay put once the price retracement ends Point-Z. This was accompanied by the long-term decline in USD / CHF, which can be experienced even today. Otherwise, finding that a basic Fibonacci level was clean and tested successfully, an operator can make several trades in a short-span chart, even in 1 hour, seeking items for selling USD/CHF. Use a long-term plan while entering shorter-term time frames, keeping higher risk-reward ratios and tight stop-loss in your trade.
One of the possible targets in your trades can be either the beginning of the retracement, expanding 100% of the starting movement, or Point Y, with the starting point being a little out of Point Y.

He is an expert in financial niche, long-term trading, and weekly technical levels.
The primary field of Igor's research is the application of machine learning in algorithmic trading.
Education: Computer Engineering and Ph.D. in machine learning.
Igor regularly publishes trading-related videos on the Fxigor Youtube channel.
To contact Igor write on:
igor@forex.in.rs
