Forex Education

Trading industry knowledge. Learn forex trading, investing in stocks, commodities.

  • Home
  • Choose a broker
  • Best Forex Brokers
  • Learn trading
  • Affiliate
  • Contact
  • About us
You are here: Home / Forex brokers reviews / HF Markets Review / Where is Fibonacci Indicator in HF Markets Platform?

Where is Fibonacci Indicator in HF Markets Platform?

by Fxigor

The Fibonacci indicator is one of the most popular technical analysis indicators used by traders and investors to identify support and resistance levels in the price of a security. Known as the “Golden Ratio,” this tool can be found in any trading platform, including HF Markets. It is an easy-to-use and powerful indicator that can help investors make more informed decisions about buying and selling securities.

The Fibonacci indicator is based on the mathematical sequence developed by Leonardo Fibonacci in 1202 AD. It consists of a series of numbers where each is the sum of the two preceding numbers (1, 1, 2, 3, 5, 8, 13, etc.). This sequence creates a ratio known as the Golden Ratio or phi (?), used for centuries to create art, design, and architecture due to its aesthetic appeal.

VISIT HFM

Traders use the Fibonacci indicator in financial markets to plot support and resistance levels. Identifying these levels helps traders anticipate potential areas of buy or sell orders that may lead to significant moves in price.

VISIT OANDA - APPLY $10.000 Bonus
BEST BROKERS REVIEWS
avatrade ad gold trading
Trillion Dollar Club - Invest & Trade Stocks, Crypto, Forex
trade oil ads
cfd stocks trade - ad
avatrade ad gold trading


VISIT OANDA - APPLY $10.000 Bonus
avatrade ad gold trading
Trillion Dollar Club - Invest & Trade Stocks, Crypto, Forex
trade oil ads
cfd stocks trade - ad
avatrade ad gold trading
VISIT HFM

BEST BROKERS REVIEWS
free course banner

fxpro android ad
fxpro android ad
100% bonus hotforex
100% bonus hotforex
trade ETF
supercharged bonus hotforex ad
hfm zerpo spread ad
gold trading hotforex ad
crypto trading capital ad
trade oil ads
cfd stocks trade - ad
avatrade ad gold trading
exness stable spread ad
trade metals ad
trade crypto icm

Where is Fibonacci Indicator in the HF Markets Platform?

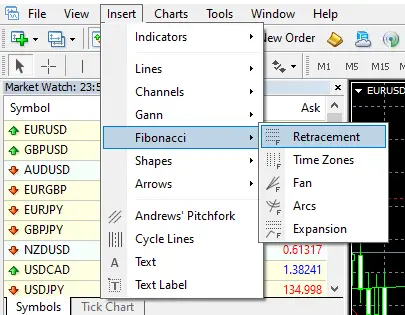
To find the Fibonacci indicator in MT4 and Mt5 platforms, you need to Insert and then choose the Fibonacci drawing tool for Retracement or Expansion.

VISIT OANDA - APPLY $10.000 Bonus

fibonacci indicator in HF markets Metatrader platform


avatrade ad gold trading
Trillion Dollar Club - Invest & Trade Stocks, Crypto, Forex
trade oil ads
cfd stocks trade - ad
avatrade ad gold trading
VISIT HFM

HF Markets provides access to this powerful tool via their trading platform, enabling users to select from several different methods for plotting Fibonacci retracements/extensions, including manual drawing or auto-tracing tools. HF Markets also provides access to advanced analytical tools such as Elliott Wave Theory and Gann Fan Analysis, which enable users to understand market movements better and make more informed decisions regarding trading.

VISIT OANDA - APPLY $10.000 Bonus
BEST BROKERS REVIEWS

VISIT HFM

VISIT OANDA - APPLY $10.000 Bonus

avatrade ad gold trading
Trillion Dollar Club - Invest & Trade Stocks, Crypto, Forex
trade oil ads
cfd stocks trade - ad
avatrade ad gold trading

free course banner
fxpro android ad
fxpro android ad
100% bonus hotforex
100% bonus hotforex
trade ETF
supercharged bonus hotforex ad
hfm zerpo spread ad
gold trading hotforex ad
crypto trading capital ad
trade oil ads
cfd stocks trade - ad
avatrade ad gold trading
exness stable spread ad
trade metals ad
trade crypto icm
  • The Fibonacci indicator is based on the Fibonacci sequence, a mathematical series found in nature and applied to the financial markets.
  • The indicator uses horizontal lines to indicate potential areas of support or resistance based on the Fibonacci ratios (0.236, 0.382, 0.500, 0.618, 0.786, 1.000, 1.272, 1.618, etc.).
  • These ratios are derived from the Fibonacci sequence and are believed to represent key levels where traders may look to enter or exit trades.
  • The Fibonacci indicator can be applied to any time frame and currency pair, making it a versatile tool for forex traders.
  • Traders can use the indicator to identify potential entry and exit points and set stop loss and take profit levels.
  • The Fibonacci indicator is often used with other technical indicators and analysis tools to confirm trading signals and enhance accuracy.
  • The indicator is widely used by both novice and experienced traders and is considered a valuable tool for identifying potential market movements and trends.
  • The Fibonacci levels can also be used to calculate retracements and extensions, which can help traders determine potential price targets.
  • The Fibonacci indicator is available on most trading platforms and can be customized to suit individual trading styles and preferences.

The Fibonacci indicator is an easy-to-use yet powerful tool that can help traders identify support/resistance levels more accurately when analyzing securities prices on any platform – mainly HF Markets’ desktop trading platform. With its advanced analytical features, such as Elliott Wave Theory and Gann Fan Analysis, users can quickly draw upon valuable historical data points when making investment decisions – all within seconds!

VISIT HFM

how to add fibonacci indicator on the chart in MetaTrader

VISIT OANDA - APPLY $10.000 Bonus

How to use the Fibonacci indicator in the HF Markets Metatrader platform?

  • Open your MetaTrader platform and select the chart to which you want to apply the Fibonacci retracement tool.
  • Click on the “Insert” tab in the top menu and select “Fibonacci” from the drop-down list.
  • Choose the “Retracement” option from the sub-menu.
  • Click and drag your mouse from the high point to the low end of the price move you want to analyze. This will draw the retracement levels on your chart.
  • Once the retracement levels are drawn, you can adjust them as needed. To do this, click on the retracement lines and drag them to different levels on your chart.
  • You can customize the retracement tool’s appearance by changing the lines’ color and thickness.
  • To use the retracement levels for trading, look for areas where the price is approaching a retracement level. If the price shows signs of resistance or support at that level, it may be an excellent opportunity to enter a trade in the direction of the trend.
  • You can also use other technical analysis tools, such as indicators and oscillators, to confirm the signals provided by the Fibonacci retracement levels.
  • Remember that the Fibonacci retracement tool is not foolproof and should be used with other analysis tools and risk management strategies to minimize losses and maximize profits.
  • Author
  • Recent Posts
Fxigor
Fxigor
Trader at Leanta Capital
Igor has been a trader since 2007. Currently, Igor works for several prop trading companies.
He is an expert in financial niche, long-term trading, and weekly technical levels.

The primary field of Igor's research is the application of machine learning in algorithmic trading.

Education: Computer Engineering and Ph.D. in machine learning.

Igor regularly publishes trading-related videos on the Fxigor Youtube channel.

To contact Igor write on:
igor@forex.in.rs
Fxigor
Latest posts by Fxigor (see all)
  • What Does Barcoding Mean in Stocks?
  • What is the Difference Between a Basis Point and Pip? – Pips vs. Bps
  • How Much are Wheat Pennies Worth? – Average Price Range List

Related posts:

  1. Fibonacci Expansion Levels – Download Auto Fibonacci Extension Indicator MT4
  2. Fibonacci Retracement Levels 88.6%
  3. How to Install HF Markets Metatrader Platform?
  4. Fibonacci Numbers and the Golden Ratio – Trading Golden Ratio
  5. Download Pivot Point Indicator MT4
  6. Download Free Hawkeye Volume MT4 Indicator! – How to read Hawkeye volume indicator?
  7. Download Zig Zag Buy Sell Indicator With Alert
  8. Vertex Mod Indicator – Free Download Vertex Mod No Repaint Indicator
  9. Download MT4 Price Display Indicator – Show Pips MT4
  10. Download Buy Sell Magic Indicator MT4
  11. Download Elliott Wave Indicator

Filed Under: HF Markets Review

Trade gold and silver. Visit the broker's page and start trading high liquidity spot metals - the most traded instruments in the world.

Trade Gold & Silver

Diversify your savings with a gold IRA.

Gold & silver portfolio-building assistance from product professionals.

VISIT GOLD IRA COMPANY If you want to trade stocks try: TRADE IDEAS

fxpro android ad
fxpro android ad
100% bonus hotforex
100% bonus hotforex
trade ETF
supercharged bonus hotforex ad
hfm zerpo spread ad
gold trading hotforex ad
crypto trading capital ad
trade oil ads
cfd stocks trade - ad
avatrade ad gold trading
exness stable spread ad
trade metals ad
trade crypto icm
VISIT OANDA - APPLY $10.000 Bonus

Website categories

Main Forex Info

  • Forex Calendar 2022
  • Forex Holidays Calendar 2022 – Holidays Around the World
  • Non-Farm Payroll Dates 2023.
  • Fed Meeting Schedule 2023. Dates! – FOMC Dates
  • Key Economic Indicators For a Country
  • What is PAMM in Forex?
  • Stock Exchange Trading Hours

Main navigation:

  • Home
  • About us
  • The Best Forex Brokers of 2023 (Ranked & Reviewed)
  • Free Funded Forex Account Without Deposit in 2023!
  • Best Forex Affiliate Programs in 2023.
  • Best Forex Brokers by Monthly Traffic of 2023
  • Brokers That Accept PayPal Deposits
  • Forex brokers reviews
  • Investment
  • Education

Forex social network

  • RSS
  • Twitter
  • FxIgor Youtube Channel
  • Privacy Policy
  • Contact us

Spanish language

Spanish language website
Risk Warning: Trading leveraged products such as Forex and CFDs may not be suitable for all investors as they carry a high degree of risk to your capital. Trading such products is risky and you may lose all of your invested capital. Before deciding to trade, please ensure that you understand the risks involved, taking into account your investment objectives and level of experience.

Copyright Forex.in.rs 2007

Privacy Policy