Table of Contents
In this review, I will discuss the background and history of Fibonacci numbers and spotlight The Golden ratio. After doing this, I will also emphasize three tips associated with money administration, which potentially can help you increase your revenue.
Exit and entry points are significant in Foreign exchange trading. A deal must know resistance and support levels to understand them appropriately and thoroughly. Percentage retrenchment levels from Fibonacci that build on the theme of Fibonacci’s number sequence system and the Golden ratio are vital for traders in the Forex community.


Fibonacci’s definition of the trading methodology is based on basic levels between high and low (between 100% and 0%). Yesterday, low and high, weekly low and high, monthly low and high, etc., are basic levels of 0% and 100%. We can add more basic levels between those levels using the Fibonacci sequence.


Learn more in detail articles on Fibonacci expansion levels.
Fibonacci sequence in forex :
Fibonacci levels are 23.6%, 38.2%, 50%, 61.8%, and sometimes 76.4% for some strategies. The most important levels are 38.2% and 50% because, in this range, the breakout is the most common. 61.8% level is excellent for support or resistance.
In technical analysis, Fibonacci levels are horizontal lines that indicate where support and resistance are likely to occur. They are based on the Fibonacci sequence, a series of numbers in which each is the sum of the two preceding ones, starting from 0 to 1. That gives us the sequence: 0, 1, 1, 2, 3, 5, 8, 13, 21, 34, and so forth.
Fibonacci levels are derived by taking various combinations of numbers in this sequence and dividing one number by another. The key Fibonacci ratios are:

- 0.236 or 23.6% (derived by dividing a number in the sequence by the number that is three places to the right)
- 0.382 or 38.2% (derived by dividing a number in the sequence by the number two places to the right)
- 0.618 or 61.8% (derived by dividing a number in the sequence by the number immediately to the right)
- 1.618, 2.618, 4.236, etc., known as Fibonacci extensions, used in trading beyond the 100% retracement level
These levels are used to identify potential reversal points in the market.
Golden Ratio:
The Golden Ratio, often denoted by the Greek letter (phi), is an irrational mathematical constant, approximately 1.6180339887. It can be found by dividing a line into two parts such that the longer part divided by the minor part equals the whole length divided by the longer part.
In the context of the Fibonacci sequence, the golden ratio is derived when any number in the sequence is divided by the previous number. As the numbers get more prominent, the ratio gets closer and closer to the golden ratio of 1.618.
The Golden Ratio is found in many areas of the natural world and aspects of human creativity such as architecture, art, and music. In financial markets, the golden ratio (1.618 or 61.8% when expressed as a percentage) is often seen as a critical level of retracement or extension for a market move, which is why it is used in Fibonacci analysis for trading.
Right, let’s learn this terminology.
The Fibonacci sequence was first found in the book Leonardo Fibonacci produced long ago, in 1202. The book detailed the Arabic-Hindu numerical problems with an answer. The exact problem described in the book was “From one pair, how many rabbits can be produced.” The productivity level can be improved if a pair delivers a new pair every 30 days.
Golden Ratio Trading Strategy
Trading golden ratio strategy means that traders need to find the previous high or previous low on the wished trading chart (daily high or low, weekly high or low, etc.) and then analyze significant retracement price levels typically translated into percentages such as 23.6, 38.2%, 50%, and 61.8% on the chart. Thus, the golden ratio trading strategy represents traders buying or selling assets using retracement and expansion levels for stop loss, entry price, and target price.
The Golden Ratio Fibonacci trading strategy involves the following steps:
- Identify Key Levels: Find the previous high and low on your desired timeframe (daily, weekly, etc.) These points will be used to draw your Fibonacci retracement levels.
- Draw Fibonacci Retracement: Draw a Fibonacci retracement from the identified high point to the low point if the overall trend is down. If the trend is up, draw it from the low point to the high point.
- Add multiple Fibonacci Retracement levels for each time frame (see video above).
- Identify Potential Entry Points: The primary Fibonacci retracement levels are 23.6%, 38.2%, 50%, and 61.8%. The 50% level, though not a Fibonacci number, is often included due to widespread use in trading. In an uptrend, these levels serve as potential support levels where the price might bounce back, offering entry points for a long position. In a downtrend, these levels serve as potential resistance levels where the price might retrace back, offering entry points for a short position. The 61.8% level, also known as the golden ratio level, is often viewed as a crucial level of support or resistance.
- Plan Your Trade: Depending on your analysis, decide whether you want to enter a long (buy) or short (sell) position at one of these Fibonacci levels.
- Set Stop Losses: Your stop loss should be placed below the next Fibonacci level below your entry point in an uptrend or above the next Fibonacci level above your entry point in a downtrend. This will limit potential losses if the price does not move in your anticipated direction.
- Set Take-Profit Levels: You can set your target or take-profit level at the next Fibonacci level. Alternatively, Fibonacci extension levels, such as 161.8% and 261.8%, can be used to anticipate where the price may run after bouncing from a retracement level.
- Monitor Your Trade: Keep an eye on your open positions. If the price behaves as expected at the Fibonacci levels, you may wish to adjust your stop loss or take profit levels accordingly.
Please see the video for more information:
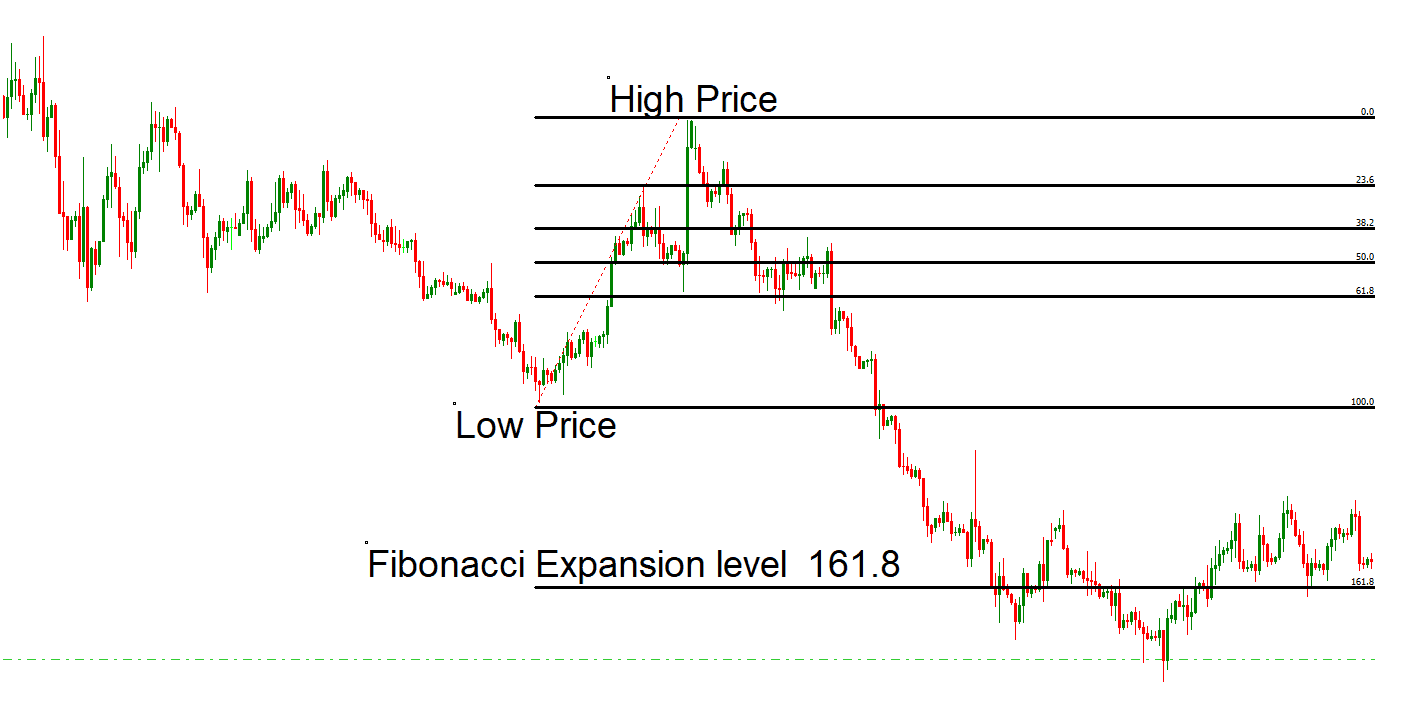
Fibonacci (Golden Ratio) Trading Strategy Example
- Step 1: Find Low and High Prices
- Step 2: If the price breaks the 61.8 retracement level, enter into trade. Make a Sell order.
- Step 3: Set stop loss to a High Price and Target a 161.8 expansion level.
The Golden Ratio
After the opening few numbers in the Fibonacci series, the ratio that will appear after every more significant number will be equivalent to .618, while the lowest number will be 1.618. These two actual numbers are known as the Golden ratio.
The proportions of this ratio are exciting and valuable for human beings’ sensory faculties, as seen in music, art, biology, and architecture. For instance, galaxies, sunflowers, molecules, and hurricanes are examples of the golden ratio.

Considerable Retrenchment Levels
- Fibonacci shows us how to stop loss levels: 38.2% and 62.8% are crucial retrenchment levels. You will find a few other important values, like 33%, 75%, and 50%.
Listed below are the top three tips for earning money with Fibonacci numbers:
Any trader can apply these numbers to make a stop loss level. For example, if at least three price levels of Fibonacci numbers appear with a different and tight spot, a dealer can put a stop loss under or above the place to settle down things.
The Fibonacci numbers can also help the dealer even if they aren’t in the right spot; if they have messed up the support area, they can close up and change the price.
- The Fibonacci determines Position size.
Fibonacci can also determine position size, which relies on the level of risk you take in your deal. For example, if the prices are precisely on a required level, then at that time, you would probably wish to have multiple positions that could move your price further.
- Fibonacci defines targets
In Fibonacci numbers, you can take advantage of it to profit when the pattern has finished in a price zone. This objective will assist the traders in being analytical in their strategy.
Conclusion
The strategy, based on crucial Fibonacci retracement levels, including the golden ratio (61.8%), provides traders with potential entry, exit, and stop-loss points.
While these retracement levels often act as strong support and resistance areas where the price may reverse, they do not guarantee future price movements—as such, using the Fibonacci trading strategy and other indicators and tools to confirm potential trading signals is essential.
Furthermore, even with these tools, risk management is crucial. Traders must always set stop losses and take profits to manage their risk effectively and not risk more than they are comfortable losing on any given trade.
Despite its complexity, the Fibonacci trading strategy is popular due to its potential to pinpoint precise levels of interest in the market, making it a valuable component of many traders’ toolkits. Nonetheless, like all trading strategies, it requires practice, experience, and a solid understanding of the underlying market dynamics to be used effectively.

He is an expert in financial niche, long-term trading, and weekly technical levels.
The primary field of Igor's research is the application of machine learning in algorithmic trading.
Education: Computer Engineering and Ph.D. in machine learning.
Igor regularly publishes trading-related videos on the Fxigor Youtube channel.
To contact Igor write on:
igor@forex.in.rs
Related posts:
- Fibonacci 88.6% Level – Important Fibonacci Retracement Levels
- Fibonacci Expansion Levels – Download Auto Fibonacci Extension Indicator MT4
- The Best Divergence Trading Strategy
- Reward to Volatility Ratio in Trading
- The Best Forex Trading Strategy that Work?
- Engulfing Trading Strategy – Case Study
- Risk Return Ratio – Risk Reward Ratio Explained
- What is the Payout Ratio – Dividend Payout Ratio Calculator
- 200 EMA Stochastic Strategy – EMA 200 Strategy!
- What is ADX indicator? – ADX Trading Strategy
- Fair Value Gap Forex Trading Strategy
- Pivot Point Bounce Trading Strategy
