Table of Contents
Trading is not a game of guesses; as a trader, you need to make informed decisions that give you excellent returns on your funds. Hence, technical traders make use of different chart patterns and tools to indulge in profitable trading sessions. One of these patterns is also called the Wedge Pattern.
Wedges are prominent in all trading communities and are trusted by the masses of traders too. Additionally, these wedges provide answers without much hassle as they are easy to read and interpret. However, a rookie must learn and understand about it to comprehend the Wedge Pattern. Wedge Pattern sustains for 10-50 trading periods and is frequently visible on any asset’s price chart. The eccentric quality of this chart is that the highs and lows of price coincide at a point to form a triangular shape. The wedges are classified into two types- The Rising Wedge and the Falling Wedge.


In the trading market, this chart pattern indicates the probability of reversals that are imminent in the direction of price action. Hence, equipping traders with the knowledge to modify their trading strategies and plans according to the situation. This Wedge Pattern can also hint towards the sustenance of a trend. To use the Wedge Patterns to their full potential, keep reading on to find how they work, how you can identify them, and use them with other strategies.


Classification of wedges
Wedge Patterns are of two types, and traders should comprehend how to spot each. These types are:
- The Rising Wedges are also called The Rising Wedge Pattern.
- The Falling Wedges are also called the Falling Wedge Pattern.
When compared based on principles, both these types have the same working pattern, with some minor variations. These types also have the same structure and shape and include three key features that make it easier to recognize them. These characteristics are:
- Both these wedges comprise the upper and lower trendline that are bound to collide over time.
- When these wedges form, the volume is bound to decline when prices move across the pattern.
- In both types, the finishing point of the pattern is determined by the breakout that happens towards the trendline with a high slope.
After understanding these key components, it is now time to discuss the differences between both types of wedge patterns in more depth.
What is the Rising Wedge pattern?
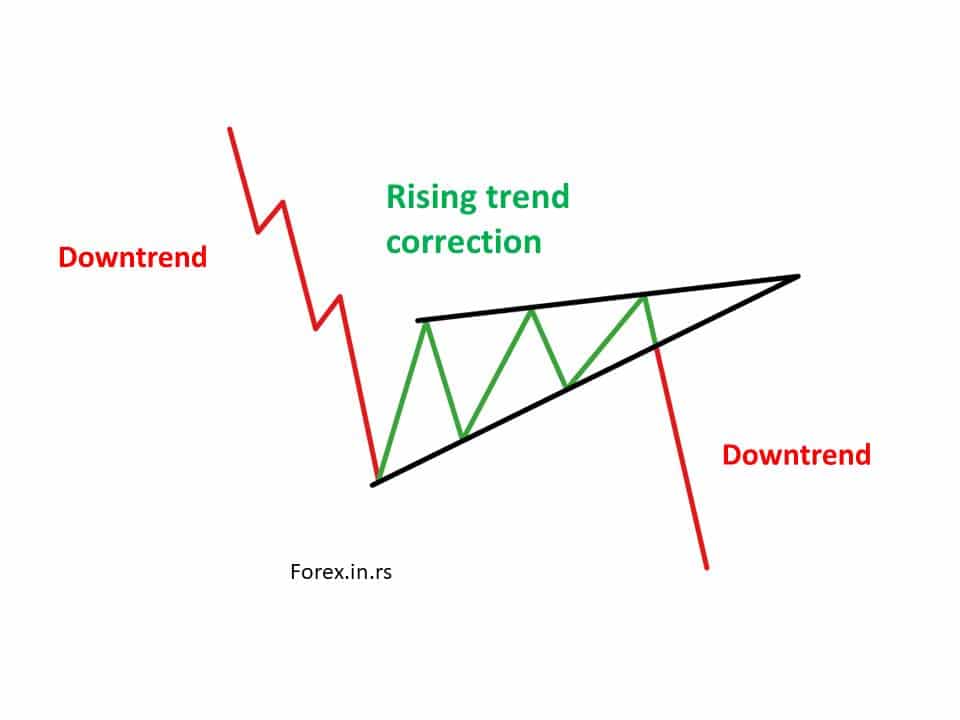
The rising wedge pattern represents a bearish continuation pattern that is formed after the rising correction. In a bullish trend, price bounces between two slopings begin wide at the bottom and contract as prices move higher. After the rising correction, the continuation patterns follow the major downtrend.

As the name suggests, a Rising Wedge pattern means the trendline is going upwards and converging at that moment.
In the Rising Wedge pattern, the upper line of the trend that is responsible for determining the hikes in prices rises at a slow speed compared to the lower line of the direction with time. During this pattern creation period, the price of the asset will increase. However, the momentum will decrease inevitably. The decrease in momentum shows a probability of a reversal in the market, and prices are prone to going down. Hence, the bearish reversal is represented by this pattern.
At certain times, you can also spot a Rising Wedge pattern that also makes a sighting on the price chart of an asset if there has been a powerful downtrend. If this situation occurs, there can still be a breakout towards the bearish market. Hence, a Rising Wedge is also considered as a Bearish continuation chart pattern or bearish reversal.
In conclusion, a bearish reversal or bearish continuation chart is sighted on the asset’s price chart after a high momentum has prevailed. Two coinciding trend lines determine it. These lines are known as the Upper trend line and lower trend line. Moreover, for the Rising Wedge, the momentum and slope of the upper line are less than the lower trendline.
What is a falling wedge pattern?
The falling wedge pattern represents a bullish continuation pattern that is formed after downtrend correction. In a downtrend, price bounces between two downward slopings begin wide at the top and contract as prices move lower. After the downtrend correction, the continuation patterns follow the major rising trend.
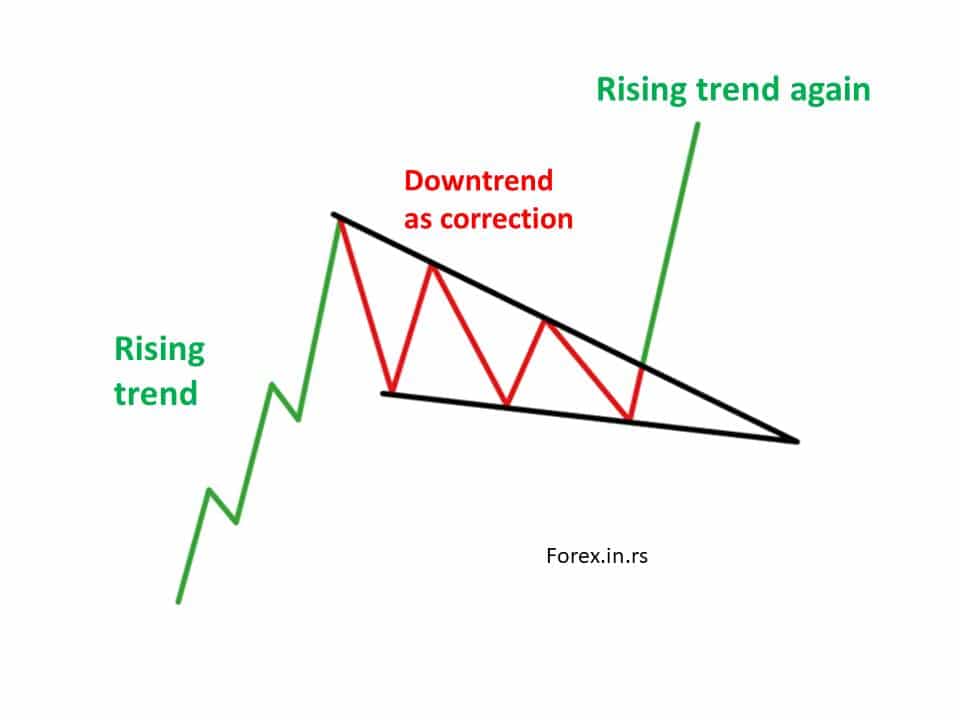
The Falling Wedge pattern means that both the lines of the price chart converge when they are going downwards. When this pattern forms, the line representing the series related to security prices lowers over a fixed period, and the descent is slow compared to the upper trend line. This pattern is dominant after a downtrend in the market, which is also a sign of bullish reversal. However, one of the similarities between Rising Wedges and Falling Wedges is that they can also form after an uptrend on rare occasions. Hence, it is also considered as a bullish continuation chart pattern.
In conclusion, a Falling Wedge pattern is also called the bullish continuation chart pattern or the bullish reversal, represented by the colliding upper trendline and lower trendline. Such lines are formed by connecting consecutive price high and price low points on the price chart when the Falling Wedge pattern, both the slope and momentum of the lower line are lower than the upper line of the trend.
How to recognize the rising and falling wedge patterns?
Both types of wedge patterns are some of the most accessible patterns to recognize. However, if you are an amateur in the trading market, it will take some time to breathe in the various elements of these patterns and understand them fluently. However, if you are an active trader, this should not take long because these patterns share some features with other chart patterns like the Pennants and Triangles.
You can utilize the following two methods to understand and recognize the wedge patterns effectively.
- I am using geometry and shape recognition to identify rising and Falling Wedge patterns.
- I am using technical indicators and tools to find rising and Falling Wedge patterns.
To get the best out of your trading technique, you should use both the methods above in coordination with each other. Let’s move on to discuss the various techniques on how you can identify the wedge patterns.
With the use of geometry and shape recognition
Several structural elements define both types of wedge patterns. If you comprehend these elements, you can quickly determine the wedges appearing on the price chart of an asset.
Here are some of those structural components that will come in handy:
- Upper trendline.
- Lower trendline.
- Breakout.
- Convergence.
- Slower trading volume.
- Preceding trend.
Let’s discuss these components in brief now.
Upper trendline
This upper trendline is created with consecutive price high points that prevail over the period.
- If there is a Falling Wedge, the upper trendline will have a higher slope. Moreover, when this line forms, there will be a price breakout through this trendline.
- On the other hand, if there is a Rising Wedge, the upper trendline will display a slope lower than the lower trendline. If the price keeps moving and passes the trendline, it indicates an invalid or Falling Wedge pattern.
Lower trendline
This lower trendline is created from consecutive price low points depicted over some time.
- The Falling Wedge pattern has a trendline that comprises a lower slope than the upper line of trend. Further, if the price falls below this line, it indicates a Falling Wedge pattern.
- The Rising Wedge pattern contains a high slope as compared to the upper trendline. When this trendline that the price breakouts after the completion of the pattern.
Breakout
This is the point where the price reversal is imminent, and it has already been set in motion.
- If you recognize a breakout above the upper trendline, it is a Falling Wedge.
- If the breakout is below the trendline, it is a Rising Wedge.
During a breakout, the market will go back to the previous stage before the pattern was formed.
Convergence
When the wedge pattern is forming, the upper and lower trendline tend to dwindle or contract towards each other. As time passes, the trendline will start moving in the same direction at different speeds. The result is that these trendlines do not develop a parallel pattern; instead, they move in a colliding trajectory when this pattern develops.
- If the lower line of trend moves at a rapid pace and has a high slope compared to the upper trendline, it is a Rising Wedge.
- The upper trendline comprises a higher slope than the lower trendline and moves at a rapid pace; it is a Falling Wedge.
Slower trading volume
When the trendlines intersect each other, it is inevitable for the volume to decline. This spikes the chances of the breakout in cases of both Falling Wedge or Rising Wedge patterns.
Preceding trend
A prevailing price trend always precedes the wedge pattern. This trend is recognized through the high volume in which the securities are traded.
This trend is generally bullish when there is a Rising Wedge in the market. However, the Falling Wedge is characterized by a downtrend or bearish trend. Furthermore, it would help if you always kept in mind that there should always be strong momentum and a price change in the market for a wedge.
Using technical tools and indicators
Since wedges have various components, they are comparably easy to understand and interpret. However, if you want to do this part ultra-quick, we suggest you use the technical tools and techniques the trading market is brimming with.
Keep reading below to find some essential indicators and concepts present in the technical trading world, and these can help define a wedge pattern.
Japanese Candlesticks
The candlestick patterns representing an opening, closing, high, and low prices are beneficial in identifying the wedge pattern. The trader can use these to find the uptrend and downtrend over a specific period. If you learn to identify the highs and lows, you can quickly draw the upper and lower trendline, which is a crucial part of identifying the wedge pattern.
Therefore, Japanese Candlesticks can simplify your process of recognizing the wedge pattern.
VPT or Volume price trend indicator
We have already discussed how the price will fall after the trendlines intersect, and there is a spike in price when the breakout happens again. Because of this point, the volume indicator can be utilized to measure the trading volume altercations and can also be used as a point for determining the wedge patterns on the price chart.
You can also use other volume tools and even volume itself to find the wedge patterns.
However, VPT is the most befitting choice to achieve this goal. This tool also defines the changes in price about the volume and direction of the price change. Hence, you will acquire both the direction and volume of the modifications, which is crucial for finding the wedge patterns.
Elucidating the wedge patterns
Wedges leave a surprising effect on the market. They are often the source of ambiguous signals to the traders who are unaware of their use and identification. Hence, to be confident in all your trading decisions, you must understand the substantial factors in the market and facilitate wedge pattern formation.
For the same reason, moving forward, we will understand the emotions that run the market and the creation of wedges in brief. So, next time, you can recognize all patterns with ease.
Understanding Rising Wedge
The Rising Wedge is the creation of 3 psychology stages in the broad market. These are:
Stage 1: The prevailing trend stage
When this pattern forms in the market, it is said that the market is in a specific trend. As mentioned before, if there is a Rising Wedge in the price chart, there will be a bullish trend that prevails in the market. Rarely, it can also be bearish as the prevalent trend.
We also discussed that whenever there is a Rising Wedge in the market, it is usually a result of high trading volumes. Based on the bullish and bearish trends, the high volumes indicate the existence of the buyer’s selling or purchasing interest for specific assets during that stage.
Stage 2: The intersection or convergence phase
In this phase, as the trend moves forward, traders start getting suspicious of the prevalent sentiment, that is, bullish or bearish sentiment in the downtrend.
Hence, a bulk of traders start to close down their positions with the intent of gaining profits or avoiding losses of their funds. Furthermore, there is also a halt to more trading activities in this stage. In case of an uptrend, short-sellers come towards the market to sell in this phase.
The conclusion to this reverse sentiment in this stage. The upper trendline and lower trendline intersect, giving birth to the convergence stage and reducing the trading volume.
Stage 3: The breakout stage
The stage where the traders run from the market to protect profits and seize losses is prevalent until the market reaches the point of saturation. As a result, the buyers are pressured to buy the securities, further pushing them into an overbought situation.
During this phase, the market cannot endure excess buyers, and a bearish breakout is triggered. This marks the formation of the Rising Wedge.
Understanding the Falling Wedge pattern
At the base, the forces behind the development of falling and Rising Wedge are the same but opposite to those responsible for the Rising Wedge formation. Therefore, you must comprehend the Falling Wedge after the Falling Wedge, which is relatively easy.
The three market psychology phases that aid in the development of the Falling Wedge is as follows:
Stage 1: The prevalent trend
Like Rising Wedges, the Falling Wedge is also created from the first stage through the prevalent trends. In the case of the Falling Wedge, the general trends are primarily bearish, and in certain rare cases, it can also be bullish.
During this formation phase, the market is lively with activity, which hints that there is strong buying and selling intent amongst the traders for the asset.
Stage 2: The convergence stage
When the lines converge in the Falling Wedge when there is an activity in the market, the sentiment around any asset, the market sentiment starts to turn opposite, compared to the prevailing trend. Hence, the short-sellers begin exiting the market in bulk, and the buying interest hikes in the market for a particular security.
As a result of this transformation of market sentiment, there is a sharp fall in the trading volume. When the buying sentiments are nurtured, the upper and lower trendline start coming to the point of an intersection, where the speed of the upper trend line is faster.
Stage 3: The breakout stage
During this stage, a stack of bullish traders start entering the market and hike the pressure on short-sellers of the asset to the extreme. This process will sustain until the market gets saturated and is oversold, and then a bullish breakout comes in. In conclusion, the onset of a bullish breakout is the indication of a Falling Wedge.
How to enhance the reliability of the rising and Falling Wedge patterns in the market?
There is always a set of limitations that govern any technical trading tool or technique. As we discussed before, wedges have several standard features with other chart patterns and tools. Hence, they may seem complex, but the concepts are clear once you understand them in depth.
Furthermore, the reliability of falling and Rising Wedge patterns can be enhanced if used with complementary tools and signals. Here is a list of some of those auxiliaries that you can use along with the wedges.
- Japanese candlesticks patterns
- Moving averages, divergence indicators, and momentum
- Fibonacci retracement and extension levels
Moving forward, we will discuss the tools mentioned above in brief so you can combine them with the Wedge in your trading strategy.
Japanese candlestick pattern
The Japanese candlestick pattern can prove very useful in supporting the finding of the Wedge patterns. This is because they are easy to recognize and interpret and easier to combine with the current trading strategy. Hence, these candlestick patterns are a good aid for the Wedges.
There are three ways to integrate the Japanese Candlestick Patterns with the Wedges and enhance the reliability of the results.
- Accurate pattern recognition
- Identify potential reversal zones
- Confirm breakouts
Here is a brief description of the working of each way.
Accurate pattern recognition
To recognize the trend of Rising and Falling Wedge Patterns, you must pinpoint the consecutive lows and highs to create pattern trendlines. These Japanese Candlesticks patterns efficiently help read about any trading session’s opening, closing, lows, and highs.
Hence, as compared to several price charts, Pinning down the upper and lower trend lines becomes more accessible, and using Wedges also becomes a more straightforward process through the candlestick pattern.
Identify potential reversal zones.
Wedges are a popular technical analysis tool. They are profuse in giving a general idea of the probability of reversal in the market; however, if you want to pinpoint the accurate reversal zone, you need to combine the complementary tools. That is where the Japanese Candlesticks pattern comes in handy and helps to improve your trade entries.
Confirming breakouts
The best way to use Wedges for trading is to combine their power with the breakout trades. However, just like any other chart, you will also encounter false breakout signals at times. Hence, when doing breakout trading, Wedges can primarily give you a confirmation signal as a complementary tool. Continuation candlestick pattern is also a good tool that you can leverage for trading purposes.
Moving average, divergence indicators, and momentum
The indicators based on moving average and momentum are the ideal solution for the chart patterns, including Wedges. These indicators work significantly for the enhancement of the signals and determining the direction of trends. Therefore, understanding these tools is essential for using Wedge patterns.
Momentum indicators can enhance the reliability of the Wedges pattern in the following two ways:
- Pattern confirmation.
- Determining breakout strength.
Moving forward, we will discuss the use of the moving average, momentum, and divergence indicators through good examples.
Pattern confirmation
The eccentric feature of Wedges is that the trading activity declines, and there is also a decline in the momentum in the phase of intersection. Hence, identifying the Wedge on your price chart for the security and the momentum indicator can help. These readings can be used to define the Wedge pattern. For the same reason, you can leverage the momentum readings directly or trace the Divergence through the price chart.
Defining the strength of a breakout
Wedges and Breakout trading go hand in hand. However, not every breakout is similar. There is also the existence of breakouts that can greatly overturn the price trajectory and also have the power to derive massive profits for the traders. However, there is also the presence of breakouts in the market that fade down after moving the price by a negligible percentage.
Hence, not every breakout invites the traders to bet on it. However, the momentum reading about the price and moving average can help determine if the current breakout will benefit the Wedge trading pattern.
Examples: Momentum, divergence indicators, moving average
After discussing the basics of moving average and momentum indicators in the Wedge strategy, now is the time to use the following momentum indicators for the aforementioned purposes.
Now we will discuss the Stochastic indicator and the MACD (Moving average convergence divergence).
MACD or Moving Average Convergence Divergence
MACD falls under the category of the Momentum indicator; this is pretty useful for defining the breakout’s direction that is bound to happen or has happened. Here is how you can confirm the signals for your trade by using this:
- Bullish trade confirmation: If there is a Falling Wedge and the short moving average of MACD is beyond the longer moving average of MACD, this is the confirmation for the bullish trade.
- Bearish trade confirmation: When you trade for the Rising Wedge, the shorter moving average of MACD is below the average moving line of MACD and confirms the bearish trade.
- During each case, the direction of MACD also confirms Wedge’s pattern breakout.
Stochastic oscillator
The Stochastic Oscillator or Stochastic indicator line fluctuates between the levels of 0 and 100 and defines if a security is overbought or oversold. But, first, let’s understand how you can use this tool to enhance the reliability of the breakout trade when utilizing a Wedge Pattern.
- When the Stochastic Indicator stands at 30 or below that mark: If this reading is in harmony with the Rising Wedge, this is a sign that the breakout will occur below the lower line of trend. Moreover, this breakout may sustain, and hence, you should short-sell or sell when this breakout happens.
- When the Stochastic Oscillator stands at 70 or more mark: If this reading is in harmony with the Falling Wedge, then it is a sign that the asset stands at an oversold position, and there will be a breakout onset and uptrend. In such a situation, you should buy the security.
Fibonacci retracement and extension levels
When you accurately pinpoint a Rising or Falling Wedge, you can also find the direction on the price and the possibility of a breakout. A Rising Wedge hints towards a bearish trend, while a Falling Wedge hints towards a bullish trend.
This recognition of direction helps make sound financial decisions and helps create a profitable entry, along with finding the precise points where a breakout may occur. Moreover, defining the substance of a price trend after the breakout is another crucial point that helps in finding profitable trade avenues. However, you can easily overcome these things by amalgamating Wedge patterns with the Fibonacci Retracement and Extension tool in the trading strategy.
The Fibonacci Retracement and Extension Levels play a substantial role in making the Wedge patterns more reliable. The two roles that are played in the same are:
- Identifying beneficial trade entry points
- Identifying valid trade exit points
Identifying valuable trade entry points
Fibonacci Retracement and Extension Levels can help determine where the swings in the Wedge Pattern will tune down. With these levels, you can have the upper hand in the trading market as you can define potential reversal trading points.
Identifying beneficial trade exit points
Fibonacci Retracement and Extension Levels are significant to find the areas on the security price chart where the price wave will sustain and persist after the breakout takes place. Hence, such levels are beneficial in providing insights about the take profit points for your trading strategy.
Trading in Rising and Falling Wedges
Finding the Rising and Falling Wedges is not a very frightening task if you ask us. However, we can not vouch that it is easy to trade them in the market. Hence, it always works out in your favor when you have some great trading strategies hidden up your sleeve for these Wedge patterns.
The following section will discuss the many prominent strategies that make it easier to trade for Rising and Falling Wedge.
Wedge Pattern Breakout
This trading strategy comprises buying or selling decisions once the price comes out of the Wedge Pattern. For example, when you trade-in Falling Wedge, the breakout will trigger an uptrend while a downtrend for Rising Wedge Pattern will be.
Furthermore, there are four steps that you can use in a trading breakout to reach your goals:
- Identifying tradable waves.
- Determination of trade entry.
- Determination of the stop loss level
- Determination of the take profit level
Here is the brief of every step that is mentioned above.
Identifying tradable waves
When you rely on a Breakout strategy for trade, the tradable price line will come after completing Pattern construction.
- When there is a Rising Wedge, you will ride the bearish price wave that comes after the price goes out of the lower trend line in the Wedge pattern.
- In the case of Falling Wedge, you will ride the bullish wave that comes after the price comes out of the upper trendline of the wedge pattern.
Establishing trade entry
Here is what you should keep in mind to enter the market using the Breakout Strategy.
- The component of the Wedge pattern should be finished: You should be fluent in creating trendlines and the price chart and find out the intersection point before trading for these patterns.
- Avoid trading if the breakout has still not been identified: You should wait for the green light breakout signal before you indulge in a trade, or you may make a move on a false breakout sign.
Once this is done, you should adhere to the following pointers to secure your win even further.
- Take the extended position for the Falling Wedge to grab profits with price increase: Meaning you should purchase the security when you get the green light for a breakout and wait out the period for when the price increases and then exit the trade. You can use the Candlestick tool to confirm this signal.
- Sell short of making profits as the price decreases: Meaning you should sell the asset or sell short when you are sure that there is a breakout confirmation and then buy it again at a fallen price. You can use the Candlestick pattern here, too, to confirm the Rising Wedge breakout trades.
Establishing stop loss level
Here are the guidelines which you should utilize to establish the stop loss targets:
- Falling Wedge: In this case, put your stop loss target below the previous swing of low price for Wedge. If the price goes on to swing below this fixed point, it will infer that your trade is invalid. In such scenarios, you need to exit the trade to avoid further losses.
- Rising Wedge: Your stop loss point should be beyond the last high price swing when you trade in the Rising Wedge pattern. This step is similar to the Falling Wedge trading. However, in this case, also your trade can get invalidated, and you can absorb substantial losses. Hence, putting the stop loss point here will safeguard you from massive losses.
Establishing take profit level
You can read the points below to find out what you should consider while putting a take profit level on trading when the Breakout trading strategy for the Wedge pattern:
- Falling Wedge: You should take a conservative approach here. Hence, set the take profit target, which symbolizes the initial creation of the Falling Wedge pattern and upper trendline. This target depicts that the market will come out strong once again after the breakout.
- Rising Wedge: In a Rising Wedge, you should keep your take profit point where the initial creation of the Rising Wedge and upper trendline occurs. You have the same hope here that the market will come back up after the breakout.
If you take a more aggressive stance in the market, these guidelines will also come across as conservative for you. Hence, for trading at aggressive levels, use the Fibonacci Extension levels.
Additional things to remember.
- To determine the existence of a reversal or continuation pattern, you need to assess the direction of the price trend.
- It is a sign of a continuation pattern if the Falling Wedge starts forming amidst an uptrend. Also, if there is a breakout below the lower trendline, it is a false sign or superficial. The market will go back up again gradually.
- If there is a Rising Wedge amidst a downtrend, it is also a sign of a continuation pattern. On the other hand, if there is a breakout, it is mostly superficial, and there will always be an uptrend after.
- Just like a reversal, a continuation also consolidates for both the Falling and Rising Wedges.
Pros and Cons of Falling and Rising Wedge
Like any other technical analysis, there are also bound to be advantages and disadvantages of the Wedge patterns.
Pros of Wedge Patterns
- Experienced traders can identify Wedge patterns with ease.
- You will encounter limited subjectivity for trade entry, stop loss, or other limit points.
- Wedge patterns give you several moves if you miss an opportunity, so you can still make profits.
- Wedges are prominent on the security charts of several financial markets. Hence, you will have a plethora of trading windows that can break in profits.
Cons of Wedge Patterns
There are several cons that you should keep in mind while trading Wedges, The most important limitations are as follows:
- Beginners may find it complex to comprehend the patterns due to their structural resemblance with other patterns like Pennants and Triangles.
- You need to combine the additional tools and techniques with the Wedge patterns to boost the reliability factor.
- Wedges can also hint about reversal or continuation patterns, but these findings are not always on point.
- They can be mistaken for different chart structures in the market.
Conclusion
In conclusion, Wedge Patterns are commended mostly for their efficacy in finding out about the reversal and continuation signs. This is done through the intersecting upper trendline and lower trendline for the last trend until the market reaches saturation point, and then a breakout is inevitable. After that, wedges mostly lean towards reversal signs, but there are also continuation signals from time to time.
The Wedges have two types: Rising and Falling Wedges. These types help the trader acquire fast signals for the inbound uptrend or downtrend through which they can reap the profits. However, one should not solely focus on the patterns; combine the signals with complementary tools like Candlesticks pattern for trading in Wedges.

He is an expert in financial niche, long-term trading, and weekly technical levels.
The primary field of Igor's research is the application of machine learning in algorithmic trading.
Education: Computer Engineering and Ph.D. in machine learning.
Igor regularly publishes trading-related videos on the Fxigor Youtube channel.
To contact Igor write on:
igor@forex.in.rs
