Forex Education

Trading industry knowledge. Learn forex trading, investing in stocks, commodities.

  • Home
  • Choose a broker
  • Best Forex Brokers
  • Learn trading
  • Affiliate
  • Contact
  • About us
You are here: Home / Technical analysis / Chart Pattern / Flag Pattern Trading – Bearish and Bullish Flag Chart Pattern

Flag Pattern Trading – Bearish and Bullish Flag Chart Pattern

by Fxigor

Table of Contents

  • What is a Flag pattern?
  • Bullish and bearish flags
  • Bullish flag chart pattern
  • Bear flag chart pattern
  • What is Flag Trading Strategy?
  • Flag Trading- Pennant or Wedge
  • How to Trade Flag Pattern?
  • 1. Entry Point:
  • 2. Stop Loss:
  • 3. Profit Target:
  • The Bottom Line
  • Key Points to Remember

A technical analysis trader uses many patterns to predict the market trends and decide the entry and exit time. It helps them to get more odds of winning trades. There are various trading patterns, though the flag pattern is trendy among them. 

What is a Flag pattern?

A flag pattern is a breakout chart pattern that follows the main price trend and has a rectangular shape resembling a flag. It suggests if the trend would continue for a long time frame or would be reversed in a swift motion.

VISIT OANDA - APPLY $10.000 Bonus
BEST BROKERS REVIEWS
avatrade ad gold trading
Trillion Dollar Club - Invest & Trade Stocks, Crypto, Forex
trade oil ads
cfd stocks trade - ad
avatrade ad gold trading

This information works like a charm for traders in flag trading.

VISIT OANDA - APPLY $10.000 Bonus
avatrade ad gold trading
Trillion Dollar Club - Invest & Trade Stocks, Crypto, Forex
trade oil ads
cfd stocks trade - ad
avatrade ad gold trading

BEST BROKERS REVIEWS
free course banner

fxpro android ad
fxpro android ad
100% bonus hotforex
100% bonus hotforex
trade ETF
supercharged bonus hotforex ad
hfm zerpo spread ad
gold trading hotforex ad
crypto trading capital ad
trade oil ads
cfd stocks trade - ad
avatrade ad gold trading
exness stable spread ad
trade metals ad
trade crypto icm

Bullish and bearish flags

Bullish flag chart pattern

The bullish flag chart pattern or bull flag pattern represents the bullish breakout pattern during the main bullish trend and after a short period of consolidation, formed in an area less than 50% of bullish retracement.

VISIT OANDA - APPLY $10.000 Bonus

Price oscillation during the period of consolidation can usually be presented as a flag (Figure 1).

bullish flag chart pattern

avatrade ad gold trading
Trillion Dollar Club - Invest & Trade Stocks, Crypto, Forex
trade oil ads
cfd stocks trade - ad
avatrade ad gold trading

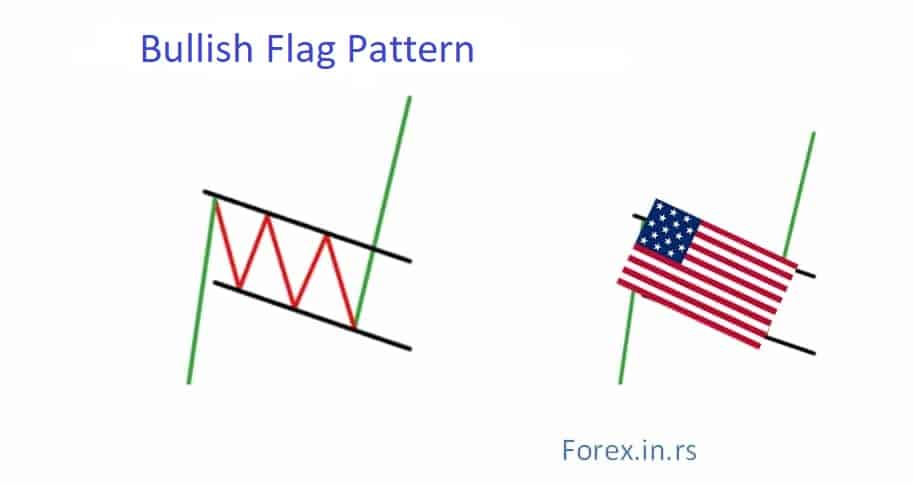
Figure 1: Bullish flag pattern

VISIT OANDA - APPLY $10.000 Bonus
BEST BROKERS REVIEWS

VISIT OANDA - APPLY $10.000 Bonus

avatrade ad gold trading
Trillion Dollar Club - Invest & Trade Stocks, Crypto, Forex
trade oil ads
cfd stocks trade - ad
avatrade ad gold trading

free course banner
fxpro android ad
fxpro android ad
100% bonus hotforex
100% bonus hotforex
trade ETF
supercharged bonus hotforex ad
hfm zerpo spread ad
gold trading hotforex ad
crypto trading capital ad
trade oil ads
cfd stocks trade - ad
avatrade ad gold trading
exness stable spread ad
trade metals ad
trade crypto icm

As we can see in Figure 1, if on the chart, the main trend is the rising trend (green color) in some moment, retracement (consolidation) will happen. The period of consolidation has a shape like a rectangle. Interestingly, this consolidation range will happen between 23.6 till 50% (Fib. levels) retracement range. Fibonacci levels can be used in Flag pattern trading strategies for better accuracy in trading.

VISIT OANDA - APPLY $10.000 Bonus

In practice and the stock market, the bull flag is very often used.
Let us see one example in this video below:

Bear flag chart pattern

The bear flag chart pattern represents the bearish breakout pattern during the main bearish trend, after a short period of consolidation, formed in an area less than 50% of bearish retracement.

Price oscillation during the period of consolidation can usually be presented as a flag (Figure 2).

avatrade ad gold trading
Trillion Dollar Club - Invest & Trade Stocks, Crypto, Forex
trade oil ads
cfd stocks trade - ad
avatrade ad gold trading

VISIT OANDA - APPLY $10.000 Bonus

avatrade ad gold trading
Trillion Dollar Club - Invest & Trade Stocks, Crypto, Forex
trade oil ads
cfd stocks trade - ad
avatrade ad gold trading

fxpro android ad
fxpro android ad
100% bonus hotforex
100% bonus hotforex
trade ETF
supercharged bonus hotforex ad
hfm zerpo spread ad
gold trading hotforex ad
crypto trading capital ad
trade oil ads
cfd stocks trade - ad
avatrade ad gold trading
exness stable spread ad
trade metals ad
trade crypto icm

bearish flag pattern

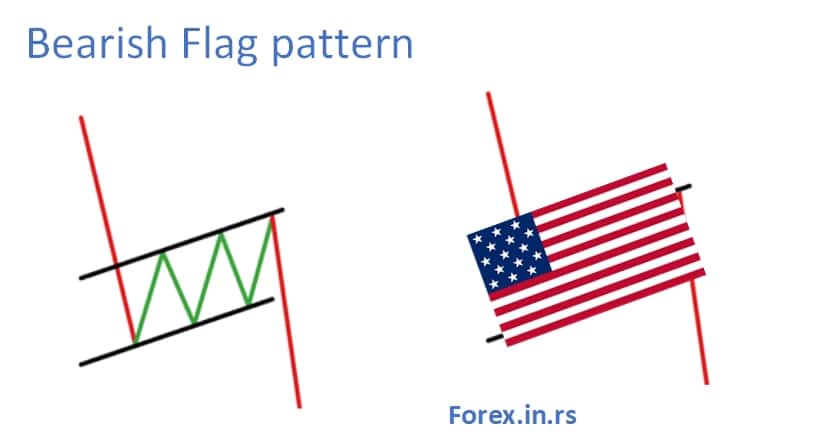
Figure 2: Bearish flag pattern

Now let us see how to recognize the bear flag pattern in practice:

What is Flag Trading Strategy?

A flag formation occurs when the price movement shows a reversal trend succeeding in a sharp price change. The flag trading strategy is made by consolidating 5 to 20 price bars. The flag formation can show bullish or bearish trends; it is not specific. The bottom line is that the flagpole’s lower body should avoid exceeding the middle part of the flagpole.

Let us understand the characteristics of Flag trading now. There are five of them.

  • The breakout
  • The previous trend
  • A consolidating channel
  • The volume of trade pattern
  • Confirmation on price moving the direction of the breakout

Whether it is a bullish trend or a bearish trend, the flag pattern holds the same structure. The only difference is in the direction of trend and volume patterns. 

avatrade ad gold trading
Trillion Dollar Club - Invest & Trade Stocks, Crypto, Forex
trade oil ads
cfd stocks trade - ad
avatrade ad gold trading

fxpro android ad
fxpro android ad
100% bonus hotforex
100% bonus hotforex
trade ETF
supercharged bonus hotforex ad
hfm zerpo spread ad
gold trading hotforex ad
crypto trading capital ad
trade oil ads
cfd stocks trade - ad
avatrade ad gold trading
exness stable spread ad
trade metals ad
trade crypto icm

In a bullish volume trend, the volume increases in the preceding trend while the consolidation decreases. In the bearish volume trend, the beginning happens the same way as the bullish pattern with increased volume, but it tends to hold after that.

Flag Trading- Pennant or Wedge

Flag trading can also be identified in the consolidation area through markets. If the flag lines converge, the flag formation can be a pennant or a wedge pattern. These are also the most trustworthy patterns as they accurately suggest the best entry and exit points to day traders.

These patterns follow breakout or volume patterns. These patterns can be identified by reducing trade volume after a hike at the initial stage. It suggests that traders were willing to trade the asset with enthusiasm first, but now they no longer want to continue the trend. Thus, the volume trend has reduced. It creates the opportunity for a new trend after the consolidation is over.

Day traders who can identify this trend can benefit by selling at the right time and starting the new trend before others.

How to Trade Flag Pattern?

Flag trading is not as tough as it seems. As a day trader, all you have to do is pick a strategy and look after only three particulars: the entry point, stop loss, and profit target.

1. Entry Point:

Often, the market gives false breakout signals; thus, you must wait for the initial breakout to occur as a trader. Most traders prefer to enter the trade after a day of the initial breakout when the prices have closed above the long position in case of a bullish market and below the short position in a bearish market.

fxpro android ad
fxpro android ad
100% bonus hotforex
100% bonus hotforex
trade ETF
supercharged bonus hotforex ad
hfm zerpo spread ad
gold trading hotforex ad
crypto trading capital ad
trade oil ads
cfd stocks trade - ad
avatrade ad gold trading
exness stable spread ad
trade metals ad
trade crypto icm

2. Stop Loss:

Stop-loss is a risk management tool and a must for all traders. In flag trading, traders keep the stop loss at the opposing side of the flag. So, if the long position in a flag trading is at $40 for a stock, and the short position is at $35 per stock, the traders would keep the stop loss at any price below $35 (if they are trading in a bullish trend.)

3. Profit Target:

Setting a profit target differs from trader to trader, though many traders prefer to consider the difference between high and low in deciding the target. For example, if the difference is $5, and the breakout happened at $20, the profit target would be $25.

In contrast, many traders also look at the high flag patterns and the base of flagpoles for deciding the profit. Let’s take an example if the flagpole base is $24 and the high is $38, considering that the breakout entry point is at $30, the profit target would be $44 ($30+$11.)

The Bottom Line

As a trader, you have to understand that no indicator or pattern is perfect, and nothing would be all the time right. It would help if you also looked after other things such as global events and other price trends to jump into the market. The best you can do is keep yourself updated and learn from your mistakes.

fxpro android ad
fxpro android ad
100% bonus hotforex
100% bonus hotforex
trade ETF
supercharged bonus hotforex ad
hfm zerpo spread ad
gold trading hotforex ad
crypto trading capital ad
trade oil ads
cfd stocks trade - ad
avatrade ad gold trading
exness stable spread ad
trade metals ad
trade crypto icm

Key Points to Remember

Here are the top five key points to give you a summary of this article.

  • The flag pattern trading helps traders knowing the prevailing counter-trend, which may replace the short-term trend, creating a shape like a flag.
  • To better predict the trend, traders often use other indicators like volume or price action.
  • Flag trading is based on trading when a trend is about to break or a reversal is accepted after a long-term trend.
  • Three main points can help you gain advantages for flag trading: the entry point, stop loss, and profit target.
  • You also need to keep yourself updated and learn from your mistakes to sustain yourself in the market for the long term.
  • Author
  • Recent Posts
Fxigor
Fxigor
Trader at Leanta Capital
Igor has been a trader since 2007. Currently, Igor works for several prop trading companies.
He is an expert in financial niche, long-term trading, and weekly technical levels.

The primary field of Igor's research is the application of machine learning in algorithmic trading.

Education: Computer Engineering and Ph.D. in machine learning.

Igor regularly publishes trading-related videos on the Fxigor Youtube channel.

To contact Igor write on:
igor@forex.in.rs
Fxigor
Latest posts by Fxigor (see all)
  • Does HF Markets Have S&P500?
  • Does HF Markets Charge for Non-Active Account?
  • How to Import the Settings File to MetaTrader 5 platform? – MT5 Set File Import!

Related posts:

  1. What is a Pennant? – Bullish Pennant and Bearish Pennant Pattern
  2. Bullish Inverted Hammer Candlestick Pattern
  3. What is Bullish and Bearish Market?
  4. Bullish Key Reversal and Bearish Key Reversal
  5. Bullish and Bearish Divergence in Details
  6. Forex Chart Pattern Indicator Free Download
  7. Megaphone Chart Pattern Success Rate – Case Study
  8. What is Cup and Handle Trading Forex Pattern?
  9. Evening Star Forex Pattern
  10. How to Trade Ascending Triangle Pattern? – Triangle Pattern
  11. Morning Star Forex Pattern

Filed Under: Chart Pattern

Trade gold and silver. Visit the broker's page and start trading high liquidity spot metals - the most traded instruments in the world.

Trade Gold & Silver

Diversify your savings with a gold IRA.

Gold & silver portfolio-building assistance from product professionals.

VISIT GOLD IRA COMPANY If you want to trade stocks try: TRADE IDEAS

fxpro android ad
fxpro android ad
100% bonus hotforex
100% bonus hotforex
trade ETF
supercharged bonus hotforex ad
hfm zerpo spread ad
gold trading hotforex ad
crypto trading capital ad
trade oil ads
cfd stocks trade - ad
avatrade ad gold trading
exness stable spread ad
trade metals ad
trade crypto icm
VISIT OANDA - APPLY $10.000 Bonus

Website categories

Main Forex Info

  • Forex Calendar 2022
  • Forex Holidays Calendar 2022 – Holidays Around the World
  • Non-Farm Payroll Dates 2023.
  • Fed Meeting Schedule 2023. Dates! – FOMC Dates
  • Key Economic Indicators For a Country
  • What is PAMM in Forex?
  • Stock Exchange Trading Hours

Main navigation:

  • Home
  • About us
  • The Best Forex Brokers of 2023 (Ranked & Reviewed)
  • Free Forex Account Without Deposit in Autumn of 2023.
  • Best Forex Affiliate Programs in 2023.
  • Best Forex Brokers by Monthly Traffic of 2023
  • Brokers That Accept PayPal Deposits
  • Forex brokers reviews
  • Investment
  • Education

Forex social network

  • RSS
  • Twitter
  • FxIgor Youtube Channel
  • Privacy Policy
  • Contact us

Spanish language

Spanish language website
Risk Warning: Trading leveraged products such as Forex and CFDs may not be suitable for all investors as they carry a high degree of risk to your capital. Trading such products is risky and you may lose all of your invested capital. Before deciding to trade, please ensure that you understand the risks involved, taking into account your investment objectives and level of experience.

Copyright Forex.in.rs 2007

Privacy Policy