Table of Contents
Amongst the many available indicators in the financial market, triangle patterns are pretty famous and preferred by many traders. A trader can use the triangle pattern in the forex market to better view the movement of the price in the coming future. The trader can also predict the trend that may follow with the help of the triangle patterns.
There are three types of triangle patterns that can be commonly seen in the forex market. Each pattern has its characteristics and different ways to interpret them.


In this article, you will read about different types of triangle forex patterns, how they can be interpreted and how to trade with the help of these patterns.


What Are Triangle Patterns?
Triangle patterns represent triangle-like shapes on trading charts which usually refer to a trend continuation.
A triangle pattern in forex is a pattern that can be seen primarily in the middle of a trend. This pattern usually indicates that the trend will continue. This pattern is straightforward to be traced on the price chart. It is made up of two lines that converge at a point. Both the lines are formed, joining the movement of price in the market. There is an upper trendline that joins the high points and a lower trendline that joins the lows. When the price movement breaks out of this pattern in the same direction as the ongoing trend, the traders plan to enter the market.
There are many charts available for technical analysis in the market. But the most commonly used by traders are only three or four. The trader can learn and use the triangle patterns on the chart they are familiar with.
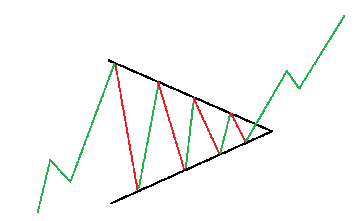
What is a Symmetrical Triangle Pattern?
Like any other triangle pattern, this pattern is drawn by joining two converging trendlines on a chart. This particular triangle pattern is also seen as a starting point for all other triangle patterns in the market. While different patterns may depict that they bend towards a specific direction, a symmetrical triangle is more direction neutral. That is, it does not fall or turn in any order. But, just like other triangle patterns, this pattern also indicates the continuation of the ongoing trend. And so, here also, traders look for breakouts towards the current trend.

How to Trade with a Symmetrical Triangle Pattern?
One of the benefits of trading with a triangle pattern is that it comes with its measuring technique. This technique can be used in any triangle pattern. Traders can calculate the ‘take profit’ target and trade accordingly.
To measure this ‘take profit’ target, the trader has to measure the distance between the upper and lower trendline at the beginning of the pattern and use the exact measurement to determine the profit target after the breakout occurs.
Amongst other triangle patterns, the symmetrical triangle is rare to find. That is why traders are advised not to blindly jump into trading and make sure they have not made any mistakes while spotting the triangle pattern.
Ascending Triangle Pattern
The ascending triangle pattern represents a rising trend pattern that implies a flat top with higher lows and shows the beginning of a bullish trend.
The ascending triangle pattern can be identified with a flatter upper trendline and a rising lower trendline. The flat upper trendline acts as a support or resistance to the price movement, while the increasing lower trendline indicates the higher lows. These higher lows show that the buyers are more active than the sellers. When there is a breakout in the pattern, it usually follows the uptrend or bullish trend.
Apart from all the indicators available as an option to all the traders, an ascending triangle can give assurance of the price action predictions. Appearing in the middle of the trend, it is also known as a continuation pattern. This pattern helps anticipate the move of the trend in the market and helps the traders plan their trade accordingly.
Read this article to understand ascending triangle patterns and how to trade with ascending triangles.
The ascending triangle is a pattern that can be identified with a straight upper line, which is also the support line of the pattern. The lower line of the triangle is slanting upwards, marking the higher lows. This pattern indicates that a bullish trend is approaching as the buyers are more active than the sellers when this pattern appears. The breakout in the pattern confirms the continuation of the bullish trend.
The ascending triangle may confirm that a bullish trend is approaching, but whether it is a continuation of the direction or a reversal depends upon where the pattern occurs in the trend. For example, if the pattern is seen during a downtrend or maybe at the bottom of it, it may mark the end of the downtrend and hence the reversal in the trend. So, the traders should be aware of the location of the ascending triangle.
The traders who have been trading in the forex now will quickly identify the ascending triangle pattern in the charts. Following are some key points that traders can look for to identify the pattern more easily:
- Upward Trend: Traders are always advised not to blindly jump into trading once they spot an ascending triangle in the trend. They should make sure if the market were in an upward trend before they saw the ascending triangle.
- Consolidating Market: Traders should be aware when the market becomes consolidated because that is when the ascending triangle may appear in the market.
- Rising lower trendline: Ascending triangle is characterized by its upward slanting bottom line. This line is drawn to join the lows in the trend, which shows the situation of a rising low. This indicates that the market is entering a bullish trend due to more active buyers than sellers.
- Flat Support Line: The support line or the upper line is flatter and works as a support or resistance for the trend. In simple words, if you look at the pattern, whenever the price touches this line, it bounces back before the breakout occurs.
- Continuation in Trend: The bullish trend continues after the price breaks out of the upper trendline. To confirm the continuation of this trend, the trader must look if the price continues to move upward.
How to Measure Ascending Triangle?
While many traders may know how to measure the ascending triangle, many may not see that pattern comes with its in-built profit measuring technique.
It’s a simple technique with merely two steps to measure the profit the trader should aim for or can expect after the breakthrough in this pattern, stating that the trend must continue.
The first step of the two is to measure the distance between the lowest point that lies on the bottom trendline and the flat upper line at the beginning of the pattern. The next step is to take the same distance and measure the possible profit from the breakthrough point.
Using this technique, the trader can aim for profit and plan his trading accordingly.
Ascendant Triangle Advantages and Drawbacks
The ascending triangle is a trader-friendly pattern. It helps the trader understand the trend if there will be a reversal or continuation in the trend. But everything comes with its limitations, and the ascending triangle is no exception to that fact.
Advantages
- This pattern is easier to identify. Even beginners can do trace this pattern with little knowledge.
- This pattern can confirm the continuation or reversal of an upward trend, attracting more and more buyers.
- Its in-built measuring technique is easy to use and helps the trader identify the possible profits.
Drawbacks
- Since the trend in this pattern is confirmed only after the breakout, there can be a false breakout. So the traders are advised to have good risk management.
- It is not always necessary that the price will move within the pattern. It can or may move lower or sideways of the triangle.
How to Trade with Ascending Triangle?
Just like the symmetrical triangle pattern, a trader can measure the distance between the flat upper trendline and the ascending lower trendline and use the same distance to measure the profit target after the breakout. Traders are advised to ensure that the trend follows after the breakout and is not a false breakout.
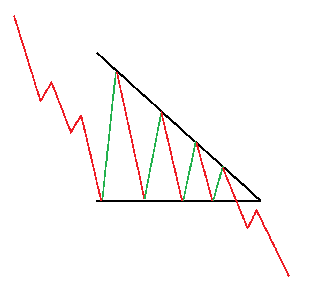
Descending Triangle Pattern
Just like the name, the descending triangle pattern is quite the opposite of the ascending triangle pattern. This pattern has a flatter lower trendline and a downward slanting upper trendline. Here, the flat lower trendline acts as a support or resistance, and the upper descending trendline indicates the lower highs. The lower high shows that the sellers are more active in the market as compared to buyers.
How to Trade Descending Triangle Pattern?
Unlike symmetrical and ascending triangle patterns, the breakout in descending triangles usually occurs with a downward trend, which indicates that the buyers sit back and the sellers try to bring the price down. This break from the lower support line encourages the trader to go short. Traders put a stop loss just above the slanting upper trendline. But the take profit target here is used by calculating the same distance at the beginning of the pattern and putting it downwards at the beginning of the breakout.
Conclusion
After reading all three types of triangle patterns, the trader must try to keep the following points in mind while trading these patterns.
- The trader must be aware of the trend preceding the triangle pattern formation. This is one of the critical points to determine the future movement of the price.
- Traders must adequately understand how to use the measuring technique discussed above to identify the profit target.
- Traders must look out for false breakouts that are not uncommon. They must also have a sound risk management plan to battle any unexpected loss.
- The trader must be efficient in distinguishing between the upper and lower trendline to understand which type of triangle pattern will occur.
- Traders are also advised to first practice identifying these patterns before actually trading with them. Because of their similar looks, traders can get easily mistaken.
- It is crucial to understand that traders must understand what the price action indicates instead of looking for the desired pattern in the forex price chart.

He is an expert in financial niche, long-term trading, and weekly technical levels.
The primary field of Igor's research is the application of machine learning in algorithmic trading.
Education: Computer Engineering and Ph.D. in machine learning.
Igor regularly publishes trading-related videos on the Fxigor Youtube channel.
To contact Igor write on:
igor@forex.in.rs
