What is a falling wedge pattern?
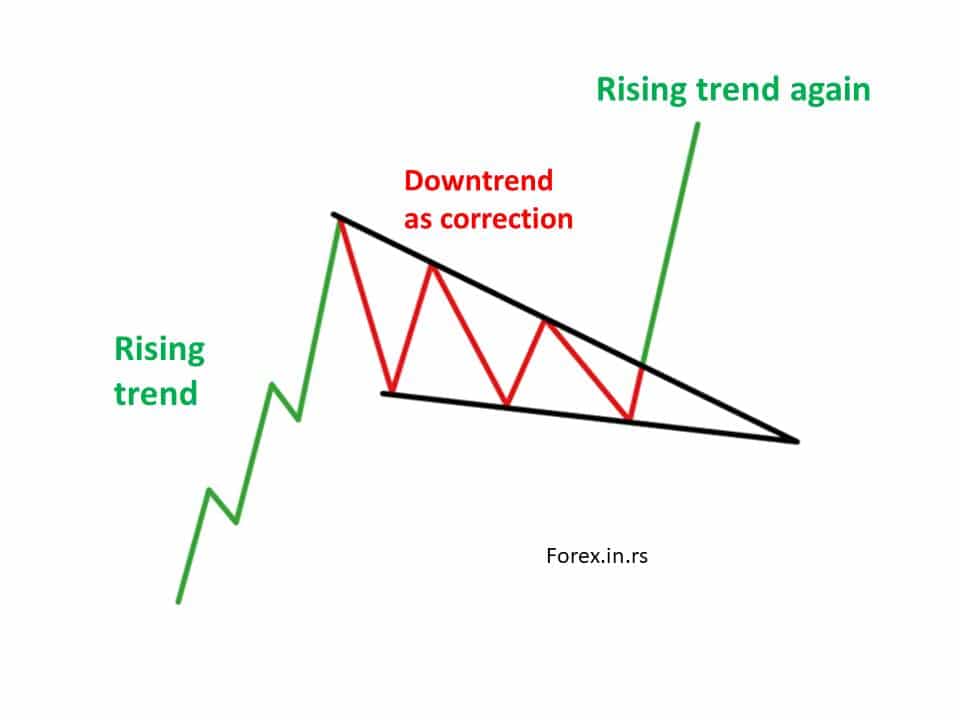
The falling wedge pattern represents a bullish continuation pattern that is formed after downtrend correction. In a downtrend, price bounces between two downward slopings begin wide at the top and contract as prices move lower. After the downtrend correction, the continuation patterns follow the major rising trend.
Falling wedge bullish or bearish?


A falling wedge is always a bullish pattern. By definition, a falling wedge always follows a major rising trend and has 3 stages: major rising trend, correction, and continuation of a rising trend.


This pattern is appropriate in denoting a bullish momentum in the market in the future.
Whenever there is price bouncing amidst two downward sloping and converging trendlines, a falling wedge pattern is generated as a continuation pattern. We can majorly understand it as a bullish chart formation. Still, it can also stand out for either a reversal pattern or a continuation pattern that completely appears in an ongoing trend.
The falling wedge pattern is the same as descending wedge pattern.
But is this as same as the triangle pattern?

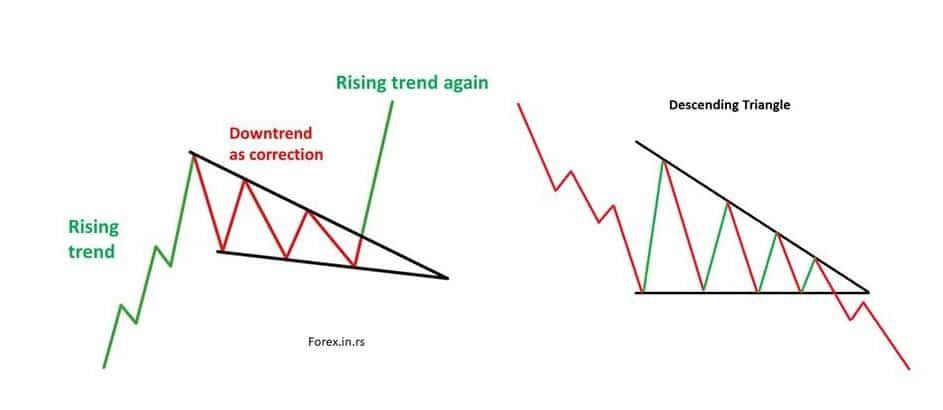
Descending triangle vs. falling wedge
The difference between a descending triangle and the falling wedge is:
- Descending triangle has a flat bottom with lower highs or a declining trendline, while the falling wedge doesn’t have a flat bottom.
- The falling wedge is a bullish pattern and follows the major rising trend, while the descending triangle is a bearish pattern.
Ways To Observe a Falling Wedge Pattern
There is difficulty identifying this pattern sometimes due to its dual interpretation as both a bullish continuation and a bullish reversal pattern. As per the ongoing scenario, there are separate market conditions that need to be considered. The major difference between the two approaches happens to be in the pattern of continuation, and a reversal is the trend’s direction on the appearance of a falling wedge pattern. While appearing in an uptrend, it happens to be a continuation pattern against the reversal pattern when the movement is a downtrend.
The process of identification:
- Observe an uptrend in case of a continuation pattern and a downtrend in case of a reversal pattern.
- You must now bring in sync the lower highs and lows by employing the trend line. Both the lines would be sloping downward and would eventually converge.
- Have an eye on the divergence between the price and the oscillator, such as a stochastic indicator or RSI.
- There is also a possibility of confirming the oversold signal by making use of oscillators.
- Now you must have an eye on the break above resistance to make a long entry.
Different Ways To Trade the Falling Wedge Pattern
By making use of certain technical analysis tools, you can trade the falling wedge pattern in the following ways:
1. The continuation pattern of the falling wedge
The descending wedge pattern aligns with an uptrend when there is a consolidation in prices, or the trade is more sideways. In this case, you will observe that you will get a slight downward slant in the wedge pattern by connecting the lower highs and lows before rising prices. This will eventually lead to a falling wedge breakout to continue on the larger uptrend formation. What is important in this method is to lace the stops at the appropriate places so that there is some space available before the final closing out of any trade. There are essentially two places where a stop can be placed for the maximum benefit, including a stop below the lowest trade price present in the wedge and a stop below the wedge only. By putting the stop loss some significant distance away, this technique would permit a breakthrough resistance in the market, thereby continuing on a long going uptrend.
There is a specific technique for measuring to set target levels: observing the commencement of descending wedge pattern followed by looking at the vertical distance in the middle of resistance and support. It then has to be followed by superimposing the same distance again ahead of the ongoing price. You will find your target at the point where the line finishes.
2. Falling Wedge Reversal Pattern
This pattern can be best employed to ascertain the spot reversals that are present in the market. The traders can observe the trendline analysis for connecting the lower highs and lows, thereby making it simpler to spot the pattern. An entry point in the market would be signaled by a break and close observable above the resistance trendline. The trader can position the trade stop loss right below the swing low and place the target either as per the measurement technique discussed above or at a preceding resistance level, which is in sync with a positive ratio of risk and reward.
A potential reversal can be realized by observing the divergence created in the market when there are lower lows in the market against the higher lows of the stochastic indicator.
Now, let us have a look at certain essential points that you must remember at all times, which include:
- Trend identification is one of the most important things
- Continuation scenario as well as a reversal scenario, both of them always are bullish patterns
- Since under both these scenarios, you would observe huge moves, Both of them carry a favorable ratio between risk and reward
Lastly, let us study the positives and negatives of the falling wedge pattern to help you make the right decision.
Falling wedge pattern advantages:
- They take place very often in the financial markets, thereby giving more opportunities.
- In the continuation case, there is a possibility of entering the financial market even after someone misses out n the initial move.
- There is clarity in terms of clear stop, entry levels as well as limit levels.
- It generally carries a positive ratio of risk and reward
Falling wedge pattern disadvantages:
- This pattern can sometimes be unclear for the novice traders
- There rests a need for additional confirmation to be made via oscillators and technical indicators
- There might be difficulties in identifying the pattern at first
- Since two patterns can take place under this scenario, the process of identification becomes rather difficult
Having understood the Falling Wedge Pattern, you must also look up other financial market patterns such as double top, double bottom, and head and shoulders to ameliorate the pattern identification skill.

He is an expert in financial niche, long-term trading, and weekly technical levels.
The primary field of Igor's research is the application of machine learning in algorithmic trading.
Education: Computer Engineering and Ph.D. in machine learning.
Igor regularly publishes trading-related videos on the Fxigor Youtube channel.
To contact Igor write on:
igor@forex.in.rs
Related posts:
- Rising Wedge Pattern and Falling Wedge
- Rising Wedge Pattern
- Ascending Triangle vs. Rising Wedge
- Why Are Precious Metal Prices Falling?
- Getting Started in Chart Patterns – Top Chart Patterns
- Evening Star Forex Pattern
- What is Cup and Handle Trading Forex Pattern?
- Flag Pattern Trading – Bearish and Bullish Flag Chart Pattern
- Hook Reversal
- How to Trade Ascending Triangle Pattern? – Triangle Pattern
- How to Trade Pinbars? – Price Action strategy!
- Morning Star Forex Pattern
