Table of Contents
Trading patterns provide a window into the market’s behavior, allowing traders to identify recurring price formations and market trends. These patterns have been observed throughout history and provide valuable insights into the psychology of market participants. By recognizing and analyzing these patterns, traders gain an edge, enabling them to make more informed and profitable decisions.
The importance of trading patterns lies in their ability to provide traders with entry and exit signals, enabling them to time their trades effectively. Whether you’re a day trader looking for short-term gains or a long-term investor seeking to optimize your entry points, understanding patterns can greatly enhance your timing and increase your chances of success.


See my youtube video about Ascending Triangle vs. Rising Wedge:


What is Ascending Triangle?
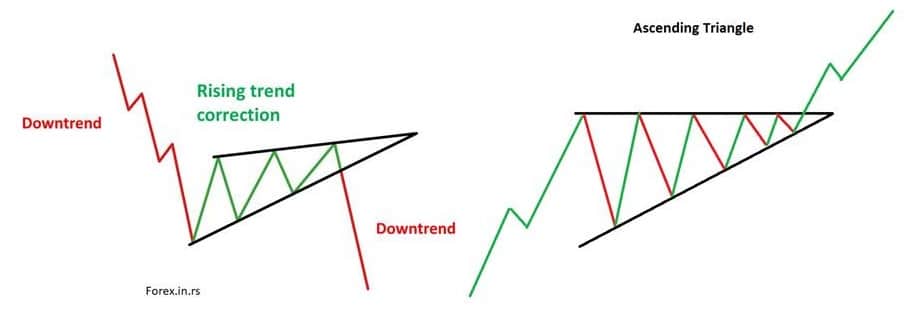
The ascending triangle pattern represents a rising trend that implies a flat top with higher lows and shows the beginning of a bullish trend.
As a result, the sellers sit back, and buyers aggressively approach the market. Therefore, continuation or reversal, whichever the case may be, the market has to offer many profitable opportunities after this pattern. However, it is advisable to always look for other patterns as the market is unpredictable.
Traders often get confused between rising wedges and ascending triangles as they both are not very commonly spotted. So it is essential to understand both to differentiate between them.

Contrary to the rising wedge pattern, the ascending triangle indicates an upcoming upward trend. It could signify a previous uptrend or a reversal signal if a downward trend appeared before the pattern appeared.
What is a Rising Wedge Pattern?
The rising wedge pattern represents a bearish continuation pattern formed after the rising correction. In a bullish trend, price bounces between two slopings begin wide at the bottom and contract as prices increase. After the rising correction, the continuation patterns follow a significant downtrend.
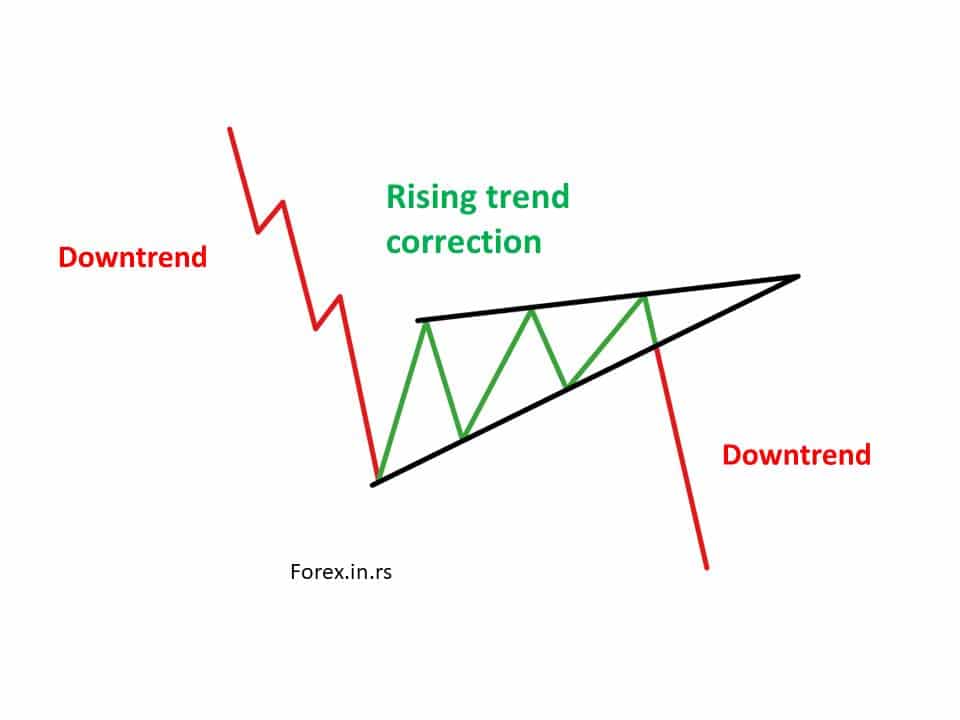
Primarily observed in downward-trending markets, the rising wedge pattern stands opposite the falling wedge pattern. Thus, traders must possess a good knowledge of both falling wedge patterns and rising wedge patterns to identify the trend and make the best trading decisions.
Ascending triangle vs. rising wedge
The difference between a descending triangle and a falling wedge is:
- The Ascending triangle has a flat top with higher lows or a rising trendline, while the rising wedge doesn’t have a flat top.
- The rising wedge is a bearish pattern and follows the major bearish trend, while the descending triangle is a bullish pattern.
Before understanding the significance of a rising wedge pattern, one should know how it is plotted on a commodity price chart. It is plotted by drawing two lines, one joining the highs and the other joining the lows, creating an angle when they meet.
One must understand that this rising wedge is indicated when the resultant angle points upwards. This positive inclination is a signal of an upcoming bearish trend. However, this trend could signify a previous downtrend or a reversal trend if it was an upward or bullish trend before the rising wedge pattern appeared. Whichever the case is, the result of a rising wedge is the following downtrend.
Not all traders are well versed in plotting a rising wedge in the price chart, as it is not commonly used. But it can be beneficial because once successfully spotted, there is no need to confirm the downtrend, like any other indicator. Instead, there will be a downtrend, and the sellers can pull up their socks to reach their selling targets. However, looking for any further changes in the market is still suggested.
As mentioned before, differentiating between the rising wedge and the ascending triangle patterns can be confusing due to their similar looks and uncommon use amongst traders. However, what they indicate is entirely contrary. One indicates a potential exit opportunity from the market, while the other indicates an entry point.
If you are new to trading, it becomes essential to understand how to differentiate these patterns. First, one can look at the pattern and acknowledge the slope of the resistance line or the upward line of the pattern. The slope in the case of the rising wedge is upward-pointing, while in the case of the ascending triangle, it is instead a straight line, and it is the bottom line that is approaching the convergence line. Also, one can confirm the pattern by noticing the trend that follows the pattern. If it is bullish, the pattern is the ascending triangle; if it is bearish, it is the rising wedge.
Another approach to differentiate between the two is when one pays attention to both patterns’ volume. For example, in rising wedges, the volume for down strings is higher than a higher upswing in ascending triangle.
Trading With A Rising Wedge
A practical approach while using the wedge or a triangle is to look for the breakouts and the pullbacks within the resistance line or the signal line of the pattern.
While working with the rising wedge, its bottom or lower line is its resistance or signal line.
The breakout in the resistance line indicates that one can enter the market but according to the direction of the break. However, there is always a possibility of false breakouts. Therefore, one must put a stop-loss to provide free space for price movement. Then, just as the trend is confirmed, traders can decide to enter the market.
It is advisable not to jump to a decision immediately after the breakout and wait for a possible pullback signal. But in the case of the rising wedge, a pullback may not be necessary, and the price movement can be very aggressive; thus, a pullback may not occur, and the price continues with the ongoing trend. In this case, the trader can stop the loss and stay in the market until it reaches the set limit.
The Advantages and Drawbacks of The Rising Wedge
Before using the rising wedge as your indicator, you must know the advantages and drawbacks that follow this pattern.
Advantages
- The rising wedge is not restricted to a single type of market, i.e., it can be used in more than one type of commodity market.
- An experienced trader can quickly identify and use this pattern. They know when to enter, limit the levels, and stop trading.
- If identified correctly, the rising wedge can provide favorable ratios to the trader.
Drawbacks
- An inexperienced or newcomer may not correctly identify the rising wedge and may get confused with similar patterns.
- It is not fixed to be a particular type of trend, i.e., it may be a continuation or a trend reversal.
- It needs to be supported by other oscillators or technical indicators for confirmation.
Trading With An Ascending Triangle
The best recommendation to trade while using such patterns is to wait for the breakout. Breakout is when the prices go out of the resistance line of the used pattern.
In the case of the ascending triangle, the breakout results in an uptrend, indicating the trader to enter the market long-term as the possibility of continuing the uptrend is high. It is also advisable to put the stop loss just below the bottom line of the ascending triangle, as it is the resistance line or signal of this pattern.
However, it is better not to jump into buying and wait for an initial pullback after the breakout. Also, be restrictive with the trading volumes as it can get beautiful to trade more initially. One must go with the flow of the trend.
The Advantages and Drawbacks of Ascending Triangle
Advantages
- It does not require any hardcore practice to identify this pattern. It can be easily identified. Also, the breakout is very clearly seen.
- It allows traders to create short-term trades inside the bounds of the pattern. But, again, this is possible because of the medium-term life of the pattern.
Drawbacks
- There is no assurance that the price may not go sideways, and that too for a more extended period; it can also result in a downtrend.
- The breakout patterns can be misleading.
Ascending Triangle and Rising Wedge Winning Rate Case Study
In the presented study, the Ascending Triangle pattern shows a higher winning rate of 73% compared to the Rising Wedge pattern at 68%. This data suggests that trades based on the Ascending Triangle are more likely to be successful. The greater reliability of the Ascending Triangle could be attributed to its clear bullish signal, which tends to offer a more straightforward interpretation.
Case Study from AutochartList:
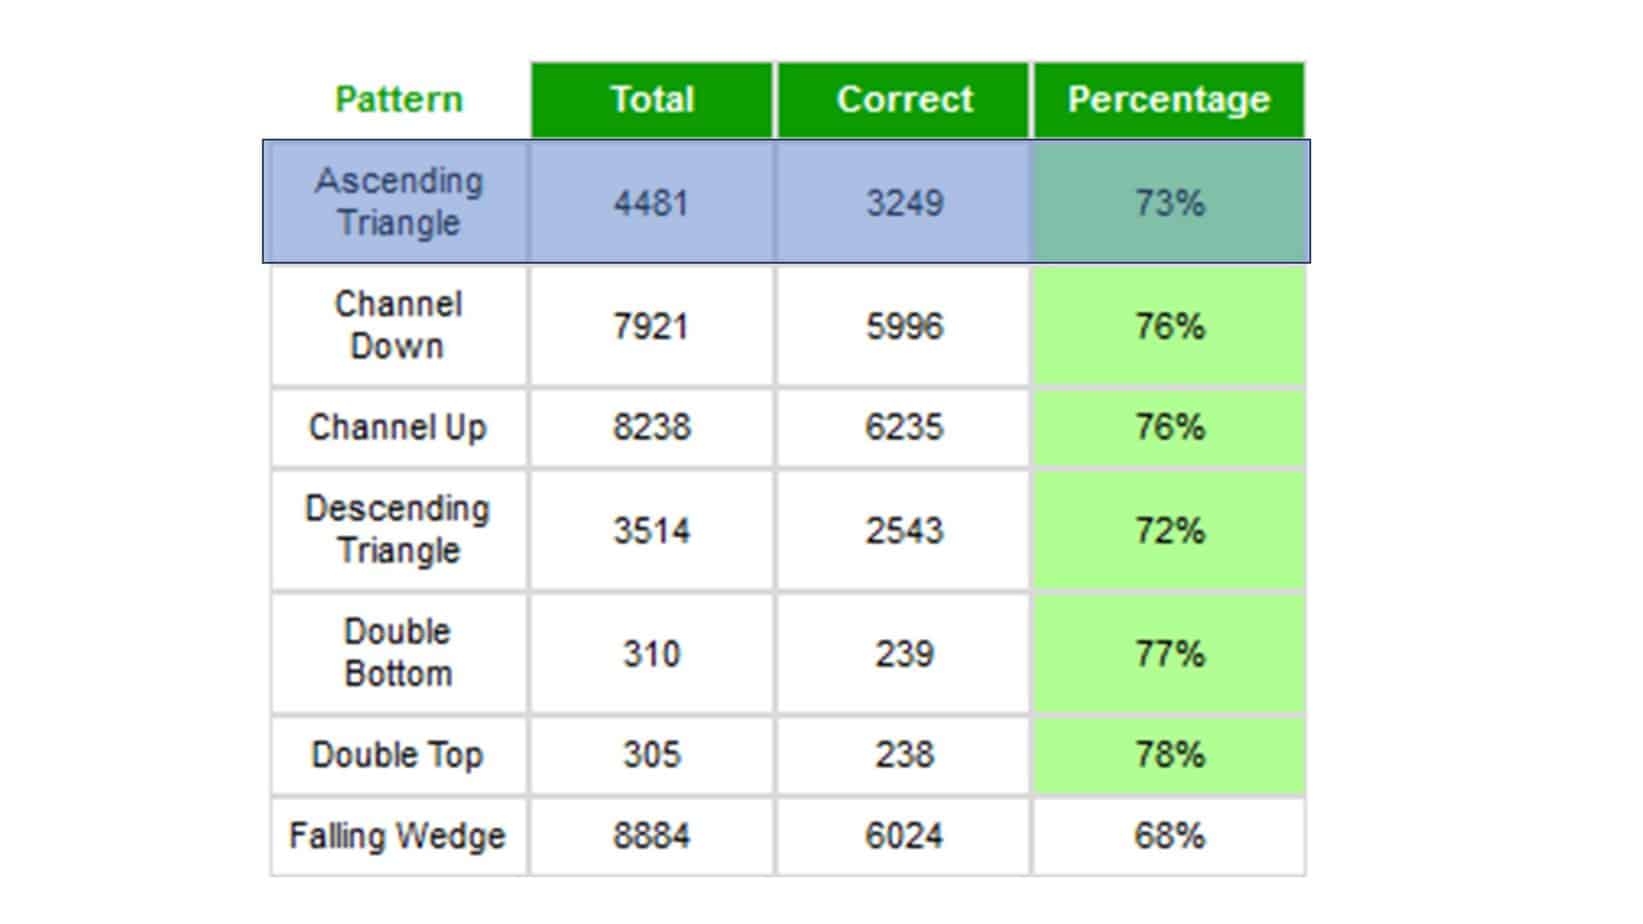
On the other hand, the Rising Wedge pattern, though slightly less successful, still presents a fairly high winning rate. Its lower success rate could be due to its complexity, as it can signify both bullish and bearish trends depending on the overall price trend context.
While these winning rates are notably high, it’s important to remember that successful trading isn’t solely about high winning rates. The risk-reward ratio, market conditions, sectors, and timeframe all play crucial roles. Also, combining technical analysis with fundamental analysis can create a more balanced and comprehensive trading strategy. Proper risk management is always vital when using these patterns in trading.
To get free signals from Autochartist, please register a brokerage account, and you will get access free of charge.
Conclusion
Both Rising Wedge and Ascending Triangle are similar and yet opposite from each other. They look similar but can easily be identified by their resistance line, sloppy in the rising wedge and straight for the ascending triangle. The former signifies a trend reversal, while the latter signifies a trend continuation. However, trading in both patterns depends upon their possible pullbacks and breakouts.

He is an expert in financial niche, long-term trading, and weekly technical levels.
The primary field of Igor's research is the application of machine learning in algorithmic trading.
Education: Computer Engineering and Ph.D. in machine learning.
Igor regularly publishes trading-related videos on the Fxigor Youtube channel.
To contact Igor write on:
igor@forex.in.rs
