Table of Contents
What is the trend line?
The trend line is a line that connects price highs or lows to show the prevailing direction of price on the chart. Trend lines are graphical representations of support and resistance and can be rising and falling.
In case of an increasing trend, the line will show the trade is in an uptrend and opposite.


How to draw a trend line?
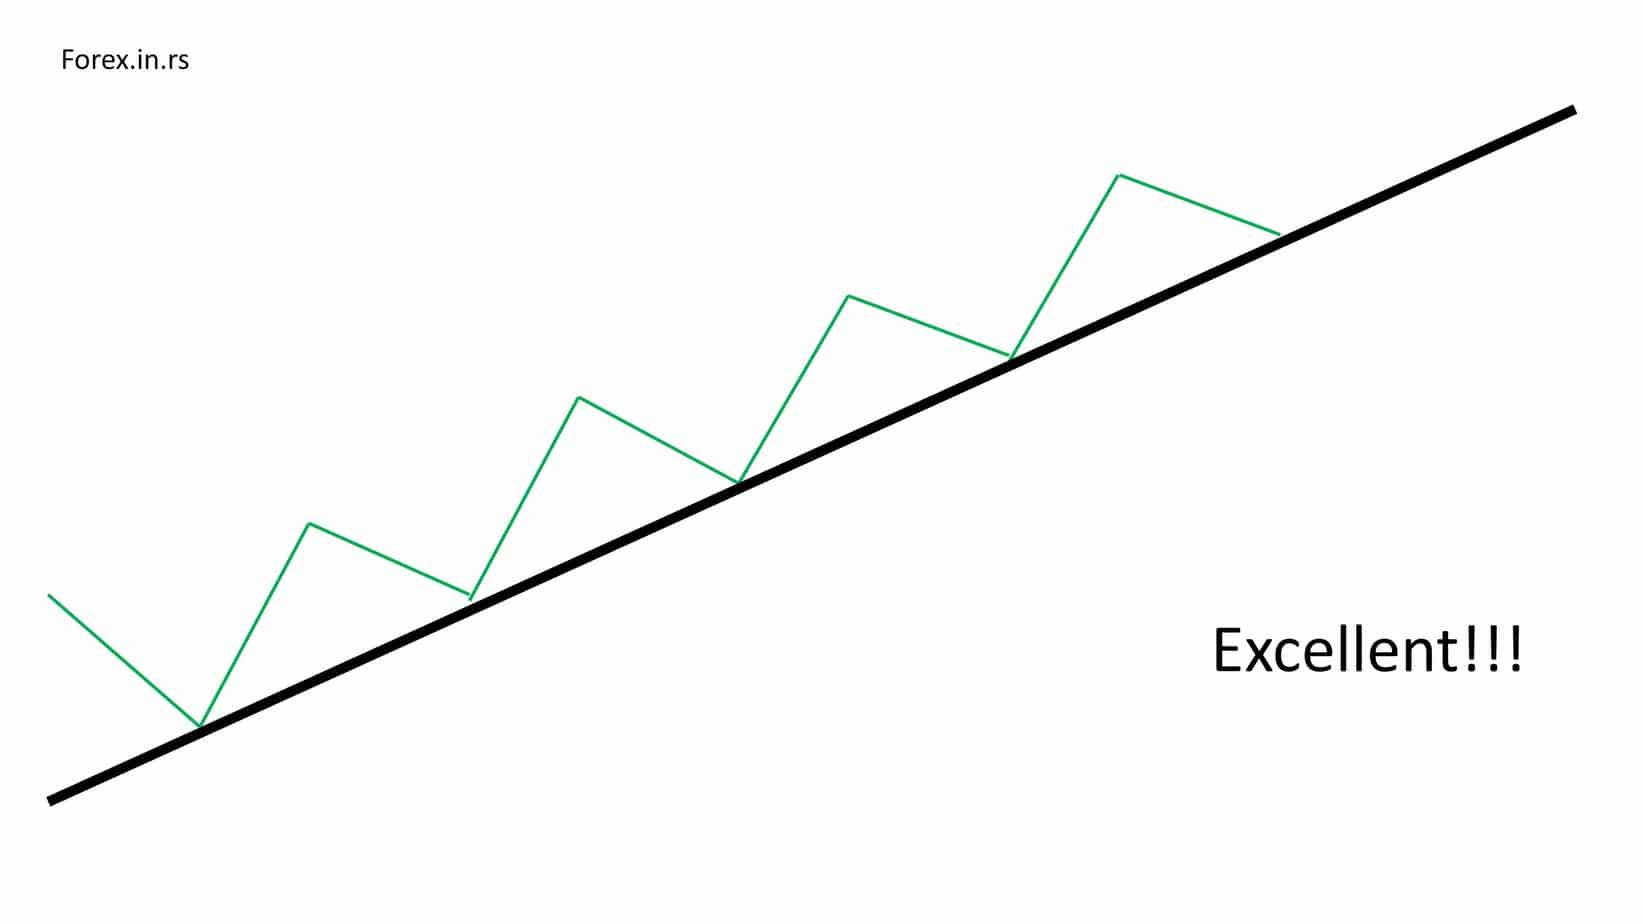
To draw a trend line, we need to connect either highs or lows using a diagonal line. To draw an upper trendline, we need to connect successive price reaction lows. To draw a down trendline, we need to connect successive price reaction highs (peaks). The trendline importance depends on the number of lows and highs that are connected. For example, the upper trendline that connects 5 lows has greater significance (stronger support) than the trendline that connects 2 lows.


Valid trendlines need to connect at least 3 lows for the upper trendline or 3 high for the down trendline.
How to draw an upper trend line?
To draw an upper trendline, we need to connect successive price reaction lows. For example, below is presented an upper line that connects 5 lows:

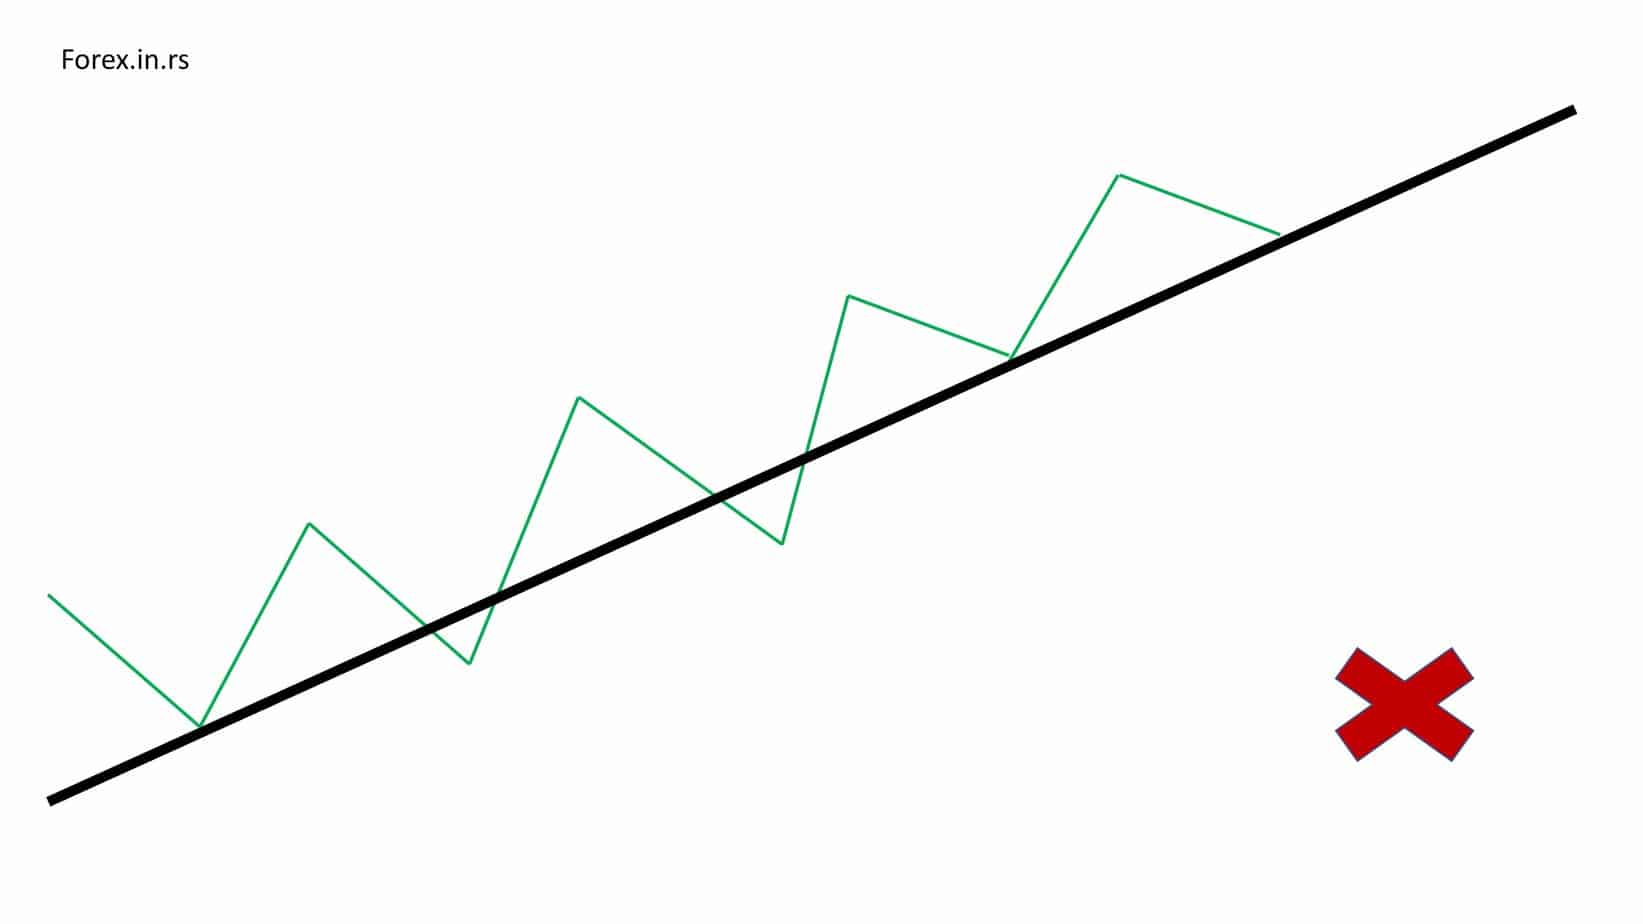
When we draw trendlines, we need to connect lower lows, and below is a common mistake where trendline does not connect lower lows:
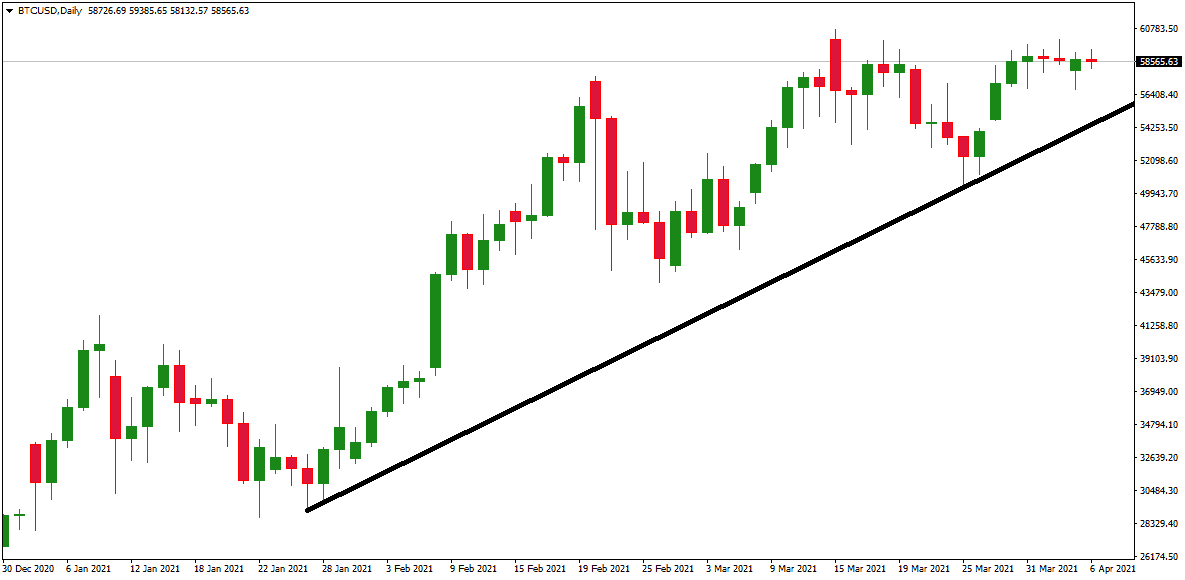
Below is a bullish (upper) trendline that is drawn on the bitcoin chart:
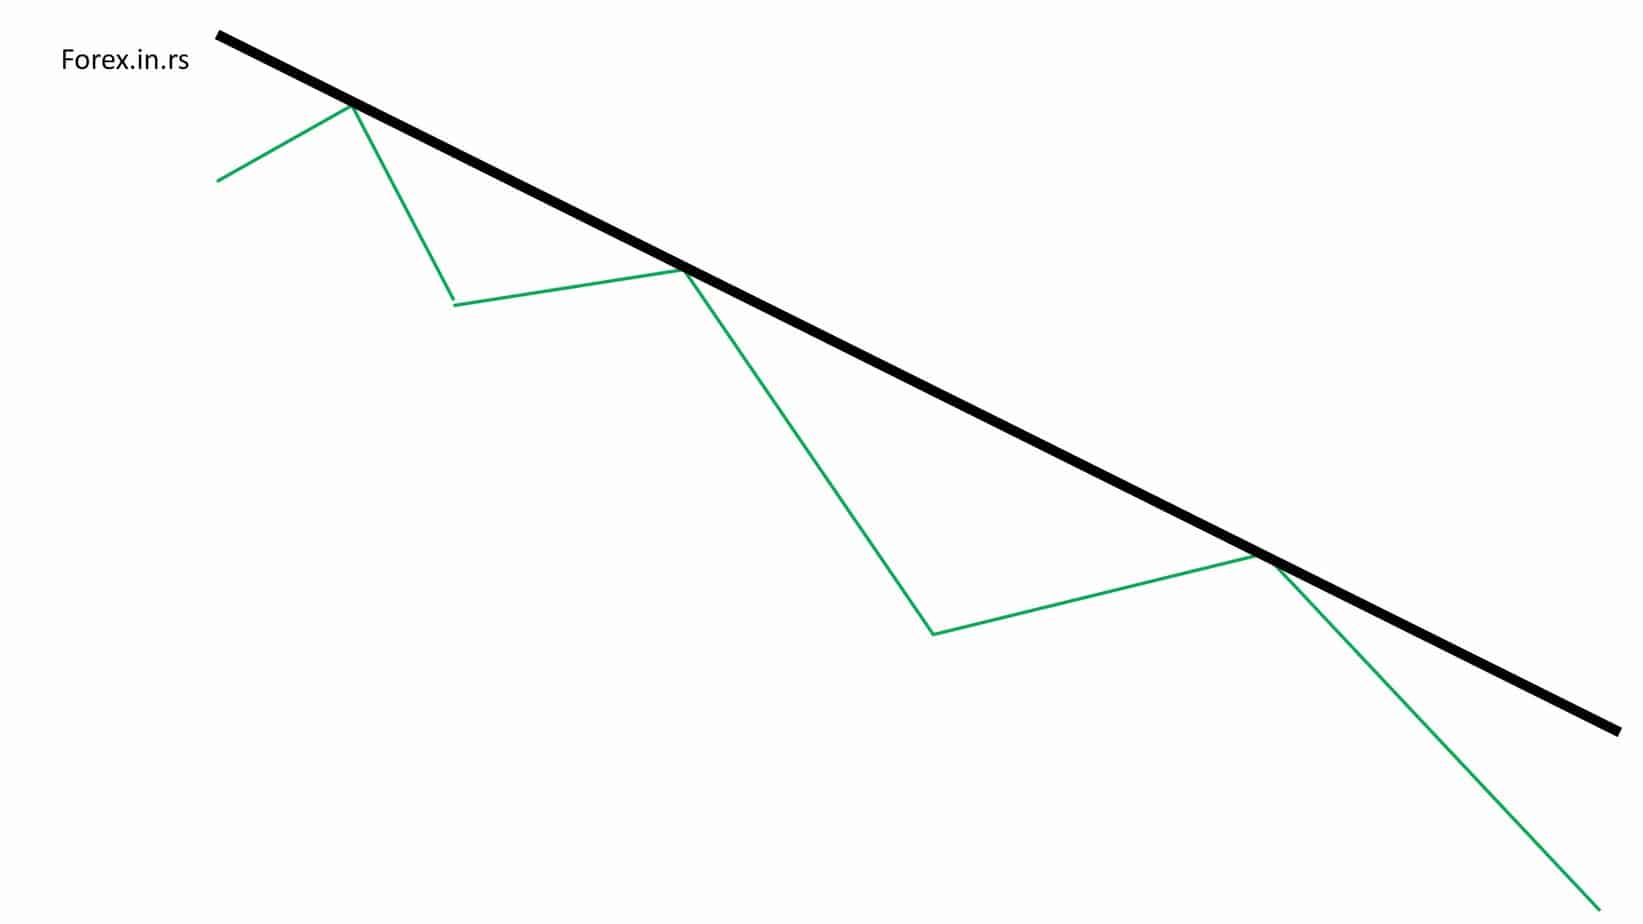
How to draw a bearish trendline?
To draw a down trendline, we need to connect successive price reaction highs (peaks). Below is presented bearish trend line that connects 3 lows:
How to draw a trendline during volatility?
During volatility, if the price has a huge spike, we can use a close price instead of a high or low price to draw a trendline. However, we need to wait for trendline confirmation, and at least several highs or lows need to be connected using our trendline.
See the example below: 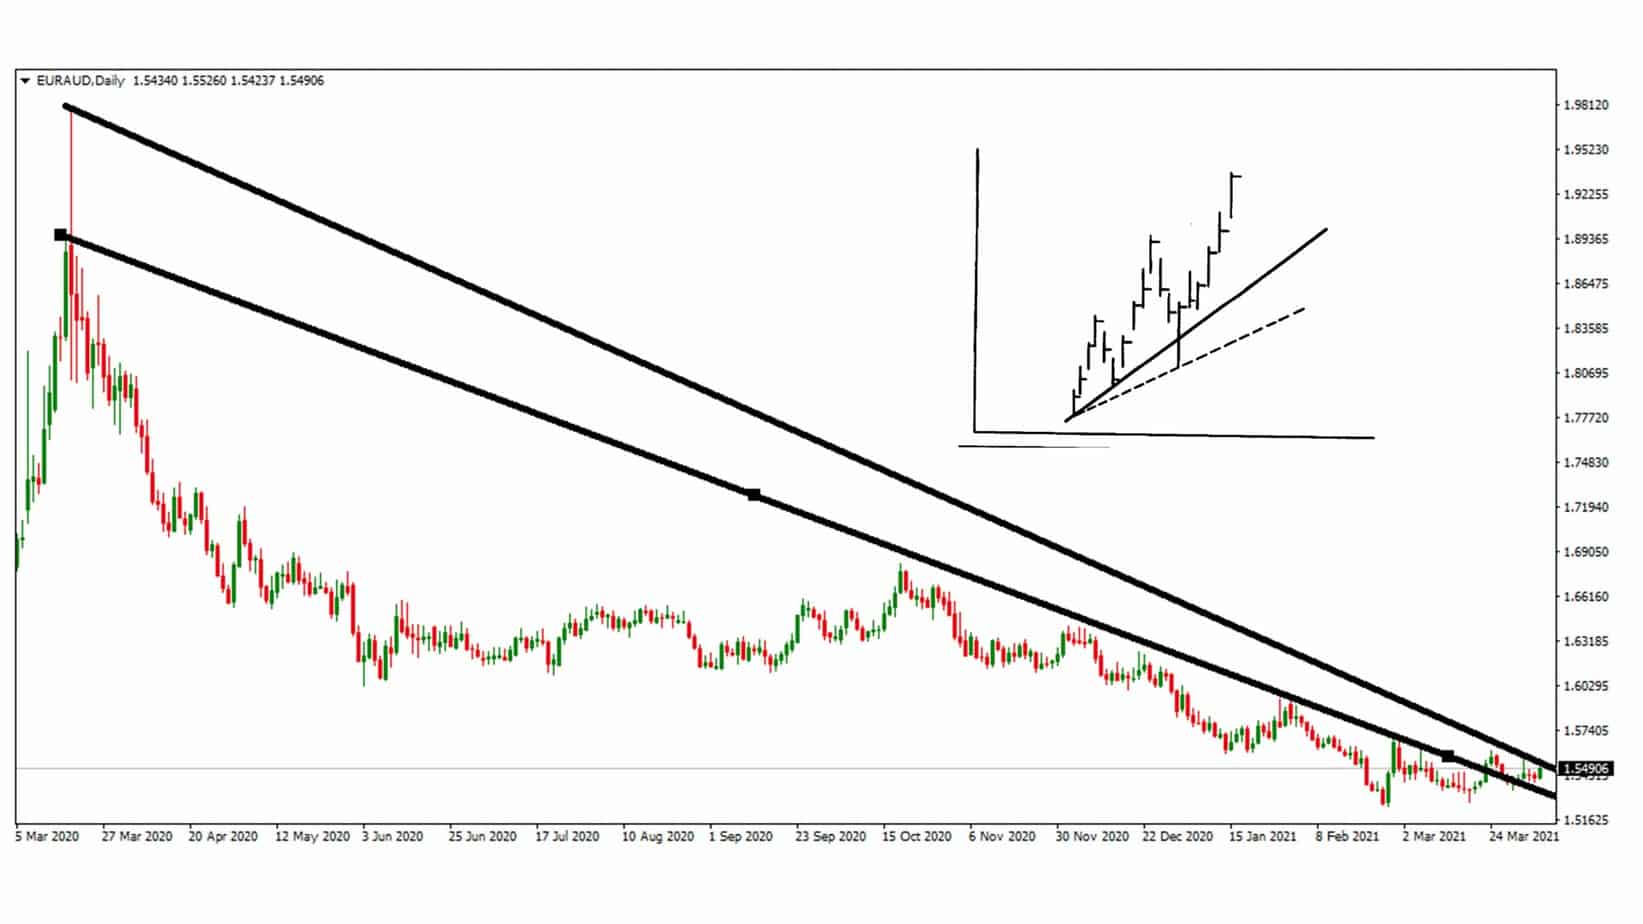 In the upper corner of this image, we can see an example of huge volatility and how to draw a trendline.
Trendline drawing tips
If you go for bigger frames such as monthly, daily, weekly, four-hour charts, you will find them the best line trends.
There are times you have to face situations such as the cylindrical sticks overlapping the trend lines. You can manage it by making the stick a bit low or high. However, you must avoid cutting the cylindrical lines from between.
You must not use force to adjust a trend line in the chart. If it isn’t the right fit, then you must leave it there.
You have to utilize points one and two to draw the trend lines, but there must be proper space between them. Traders will not accept lines that are nearby.
When you use the breakout process on the trend line, you have to hang there for the price to break on the line. The trend lines will guide you to choose the buying and selling chances, and sometimes you can even do business with the top and purchase at the bottom of the trend line. If you have larger frames, they will have more importance than the smaller ones.

He is an expert in financial niche, long-term trading, and weekly technical levels.
The primary field of Igor's research is the application of machine learning in algorithmic trading.
Education: Computer Engineering and Ph.D. in machine learning.
Igor regularly publishes trading-related videos on the Fxigor Youtube channel.
To contact Igor write on:
igor@forex.in.rs
