A stop-loss price level is crucial in price action trading because it helps traders manage risk effectively. It serves as a predetermined price point at which a trader decides to exit a trade to limit potential losses. By setting a stop loss, traders can protect their capital and prevent significant drawdowns in their trading accounts. Additionally, it helps traders adhere to their trading strategy and avoid emotional decision-making when prices fluctuate.
In the video below, I explained what is the most significant price action mistake that traders make:


Let us make a clear explanation.


A mistake traders make is setting an incorrect stop-loss price level due to misinterpreting breakout moments. Ideally, the initial leg of the trend should be used as the optimal stop-loss price level.
Look at this image:
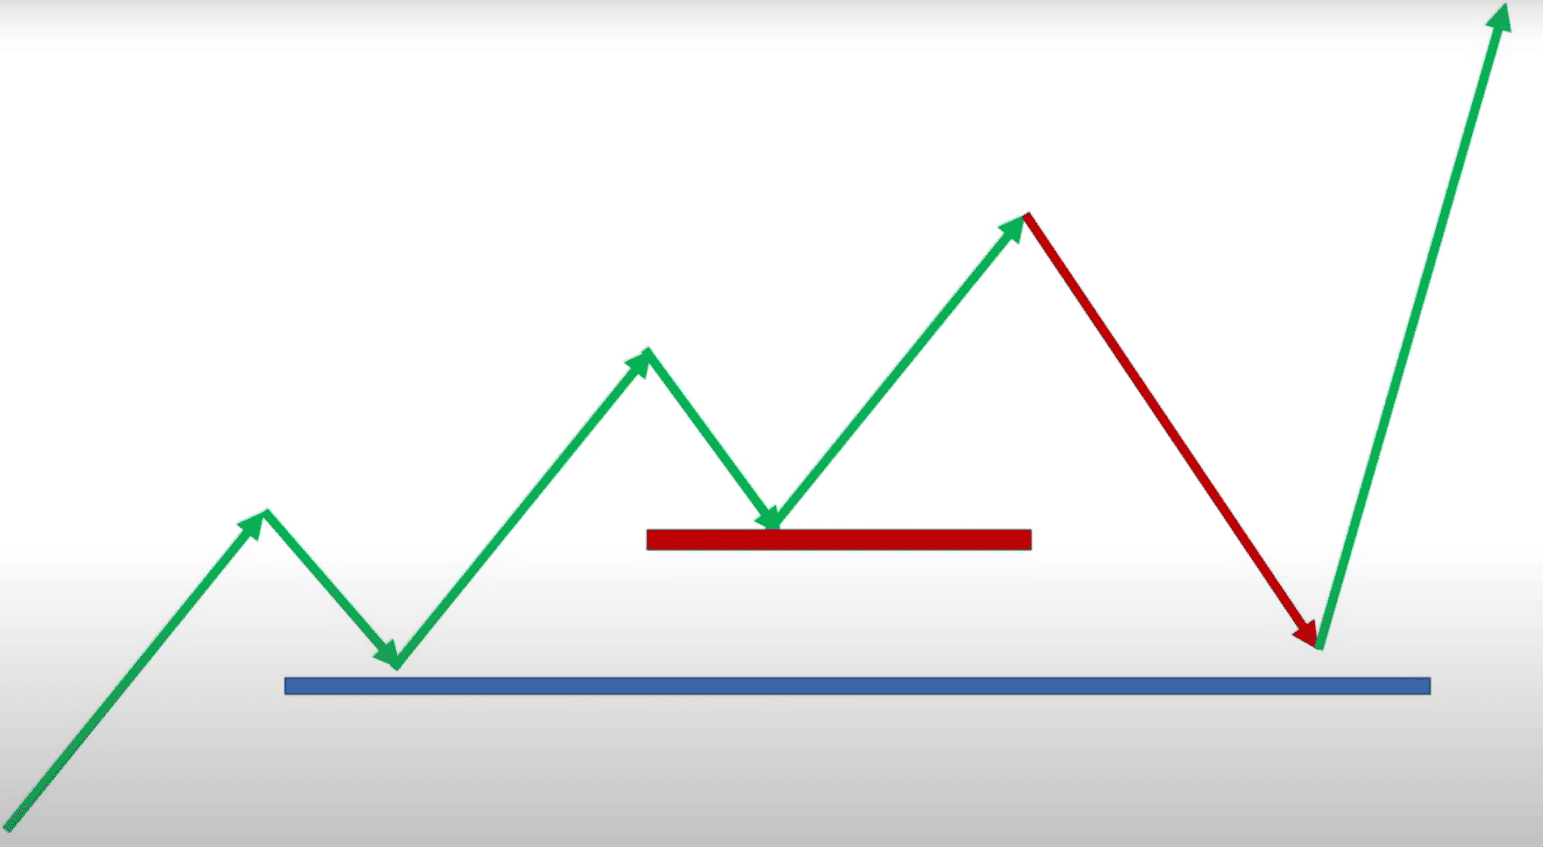
As you can see, we first have a bullish leg. The blue line is the right stop-loss price level, while the red is the wrong one.

Many traders make the mistake of placing their stop loss and exiting a trade prematurely, often after the initial breakout leg of a bullish or bearish trend. The optimal approach is to set the stop loss after the first bullish leg (see image above) for an upward trend and after the first bearish leg for a downward trend. This ensures that traders stay in the trade long enough to capture the full potential of the trend rather than exiting prematurely and missing out on potential profits.
Traders often have an idealized image of solid uptrends or downtrends as perfect 45-degree angles on price charts. This representation implies a consistent and steady directional move. However, in actual live trading, such idealized trends are relatively uncommon for several reasons.
Firstly, financial markets are inherently noisy and subject to various influences such as news events, economic data releases, and shifts in investor sentiment. These factors can lead to frequent price fluctuations, causing the trend to appear less smooth and less aligned with the ideal 45-degree angle.
Secondly, trends are rarely continuous. They often experience pullbacks or retracements, which create zigzag patterns within the overall trend. These pullbacks can interrupt the steady trajectory of a 45-degree angle, and traders must anticipate and manage these temporary reversals.
Volatility is another factor that can disrupt the perfect trend angle. Periods of high volatility, often driven by unexpected news or sudden shifts in market sentiment, can lead to rapid price movements in both directions, making it challenging to maintain a consistent trend line.
Support and resistance levels also play a role. Price trends frequently encounter these levels, which can temporarily stall or reverse the trend’s direction. These levels are not always perfectly aligned with the desired 45-degree angle, further complicating trend analysis.
Additionally, the appearance of a trend can vary depending on the timeframe of the chart being analyzed. Shorter timeframes tend to exhibit choppier trends, while longer timeframes may display smoother, more idealized angles. Traders should choose their chart timeframe based on their trading style and objectives.
Finally, market dynamics, including supply and demand, liquidity, and the behavior of market participants, influence how trends develop. These dynamics can lead to irregular price movements that do not conform to the idealized trend angle.
General Trading Rules (End of the Trend)
- Identify the number of distinct legs within the trend. A leg is typically a significant move in price in the direction of the trend.
- Look for signs of exhaustion or weakening in the trend, such as decreasing momentum, divergences in technical indicators, or overbought/oversold conditions.
- Observe any significant trendline breaks or support/resistance levels the price may approach, as these can signal potential trend reversals.
- Analyze volume patterns to see if trading volume is decreasing or diverging from the trend direction, which could indicate a weakening trend.
- Pay attention to crucial news or economic events that might impact the asset you’re trading, as these can lead to trend reversals.
- Consider using technical analysis tools like moving averages, trend channels, or Fibonacci retracement levels to identify potential areas where the trend might end or reverse.
- Keep an eye on market sentiment and trader positioning through tools like the Commitment of Traders (COT) report, as extreme sentiment can signal a trend’s exhaustion.
- Combine these factors to make an informed decision about whether the current trend is nearing its end, and be prepared to adjust your trading strategy accordingly.
While traders may hope for and occasionally encounter 45-degree perfect trends, they must be prepared for the unpredictable nature of real-time trading. It is essential to adapt trading strategies to current market conditions, manage risk effectively, and use a combination of technical and fundamental analysis to make informed decisions rather than rely solely on the expectation of a perfect trend angle.

He is an expert in financial niche, long-term trading, and weekly technical levels.
The primary field of Igor's research is the application of machine learning in algorithmic trading.
Education: Computer Engineering and Ph.D. in machine learning.
Igor regularly publishes trading-related videos on the Fxigor Youtube channel.
To contact Igor write on:
igor@forex.in.rs
Related posts:
- How to Hide Stop Loss from Broker? – Download Hidden Stop Loss and Take Profit EA
- Stop Loss vs. Take Profit – Difference Between Stop Loss and Take Profit
- Stop Loss vs. Stop Limit Order
- Price Action Trading System
- Difference Between Sell to Close and Take Profit Stop Loss!
- Download Price Action Pattern Indicator MT4
- What is Stop Loss Order?
- How to Set Stop Loss in Forex?
- How to Set Stop Loss on Bitmex?
- Download ATR Stop Loss Indicator For MT4!
- How to Fix Invalid Stop Loss or Take Profit in MT4?
- How to Set Stop Loss on Android MT4? – Set SL and TP on MT4 & MT5 Mobile
