Table of Contents
You, as a trader, can calculate stop loss in several ways. One is to set stop loss based on volatility (ATR) rather than a fixed number of pips.
I will present one custom ATR Stop Loss Indicator For MT4 that you can use in any Expert Advisor to set stop loss.


What does ATR stand for?
ATR means the Average True Range, an indicator widely used in technical and financial market analysis. ATR measures volatility in the market, how much an asset moves, on average, during a given time frame. Welles Wilder Jr. has introduced ATR in his book New Concepts in Technical Trading Systems.


In Metatrader, you can add ATR as Add indicator>Oscialltors>Average True Range. The default period is 14.
How to use the ATR indicator?
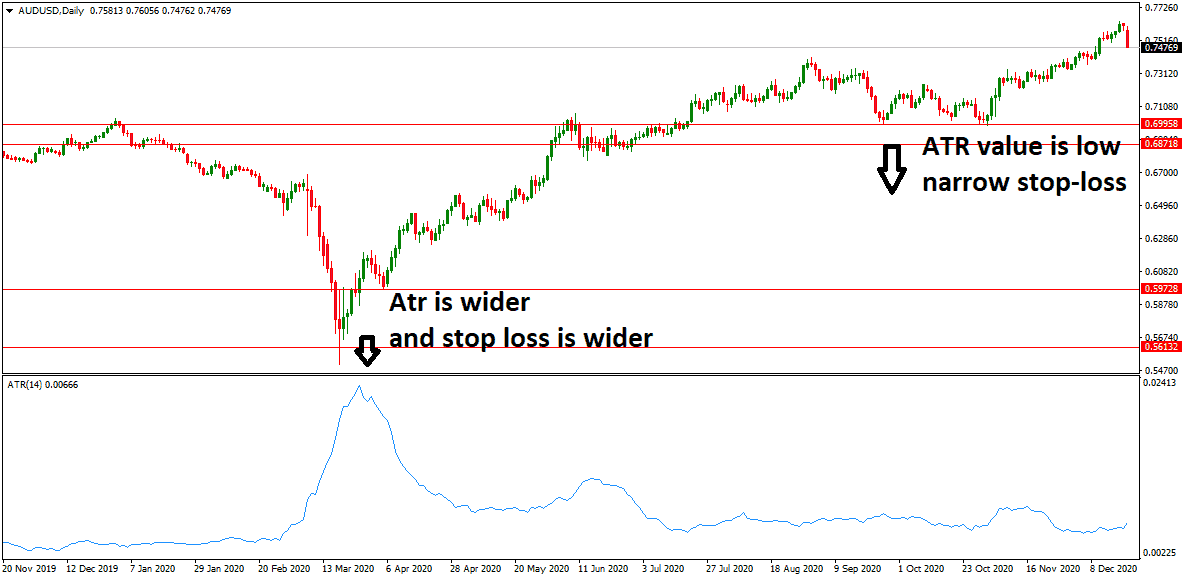
You need to add the ATR indicator to the daily chart to use the ATR indicator. Then read the ATR value from the indicator oscillator on the chart. For example, if the volatility value is 0.0090, there are 90 pips distances between the daily high and low daily average. Using ATR, traders can define the target and stop-loss.
If ATR is broader, the stop-loss and the target will be more comprehensive. On the other hand, if ATR is narrow, stop-loss and target will be narrow.

See the image below:
WHEN MAKING SUCH DECISIONS, the ATR is widely used as an exit and entry determiner in markets.
This article will discuss how ATR can improve your trading and use ATR as a stop loss. Stop-loss or sl in forex represents the allowed risk for each trade.
To use the ATR stop loss indicator in MetaTrader 4 (MT4), you’ll need to follow these steps:
- Open your MT4 platform and select the chart of the currency pair or asset you want to trade.
- Click on the “Insert” tab at the top of the platform, then navigate to “Indicators” and choose “Average True Range” from the dropdown menu. This will open the settings window for the ATR indicator.
- In the ATR settings window, you can customize the input parameters. The most common parameter is the “Period,” which determines the number of candles or bars used to calculate the average range. The default period is usually 14, but you can adjust it according to your preference.
- Once you’ve set the desired parameters, click the “OK” button to apply the ATR indicator to the chart.
- To use the ATR value to set your stop loss level, manually calculate it or use an additional indicator or script.
- Manual Calculation: Multiply the ATR value by a specific multiplier of your choice. This multiplier depends on your risk tolerance and trading strategy. For example, if the ATR value is 0.005 and you decide to use a multiplier of 3, you would multiply 0.005 by 3 to get 0.015. This value represents the distance you’ll set your stop loss from the entry price.
- Custom Indicator or Script: Various custom indicators and scripts are available for MT4 that can automate the calculation and placement of stop loss levels based on the ATR value. These tools can be found in the MetaTrader marketplace or through online forums and communities dedicated to trading.
What is ATR Stop Loss Indicator?
ATR stop loss indicator represents a simple line chart indicator that draws potential stop loss based on the current volatility of the asset.
To use the ATR stop loss indicator, traders typically multiply the ATR value by a specific factor to determine the distance from the entry price at which they will set their stop loss. The multiplier factor is subjective and can vary based on individual trading strategies and risk tolerance.
It’s important to note that the ATR stops loss indicator is just one of many tools available to traders. It should be used with other analysis and risk management techniques to make informed trading decisions.
How does ATR Stop Loss Indicator work in MT4?
ATR Stop Loss indicator draws a red line that determines potential stop loss based on Average True Range volatility. For example, if the ATR value is 0.005 and the trader decides to use a multiplier of 3, they would multiply 0.005 by 3 to get 0.015. They would then set their stop loss at 0.015 pips away from their entry price.
By using the ATR stop loss indicator, traders aim to adjust their stop loss levels based on market volatility. When volatility is high, the ATR value increases, and traders may set broader stop-loss levels to allow for more significant price swings. Conversely, when there is low volatility, the ATR value decreases, and traders may set tighter stop-loss levels to protect against smaller price movements.
Download ATR stop loss MT4 indicator.
Below you can Download the Volatility Trailing Stop MT4 Indicator and regular ATR indicator. You can set stop loss in the chart using this indicator based on ATR trailing stop price.
ATR indicator download
ATR volatility stop loss indicator mt4 download
What is ATR in stocks?
ATR in stocks represents the Average accurate range volatility indicator that measures how much, on average, asset moves during a given time frame. For example, an ATR(14) value of 28.44 on the daily chart for Amazon stock means that the average distance between the daily high and daily low in the last 14 days was 284.4 pips.
ATR Range
As the range varies, taking a designated value to measure market volatility is essential. The generally accepted practice is to adapt the best of these: the current high less the current flow, the current high absolute value less the previous close, and the current total value. It would help to take the actual average volatility more than a moving average. It is determined by using the proper range for 14 days.
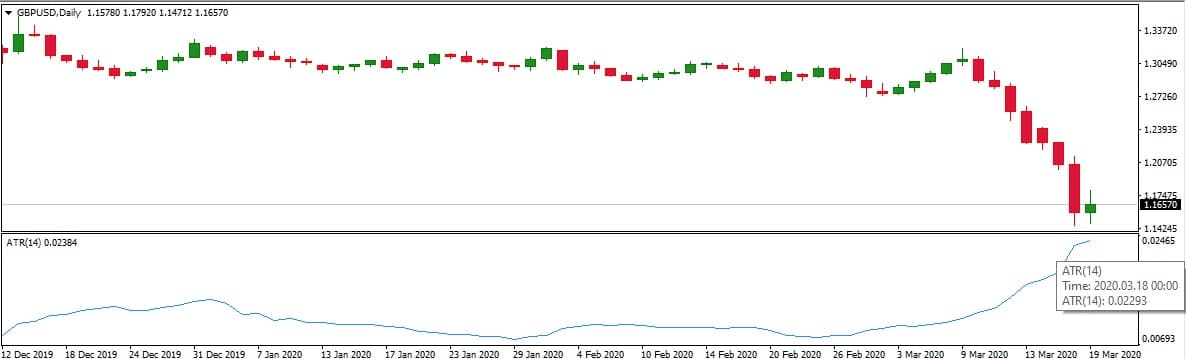
In this image, we can see on the Daily chart the Average true range. As you can see, GBPUSD is in rising volatility. Price is going down, but volatility is high. It is because of the Coronavirus news.
Today, 229 pips are the daily range, and just a week ago, it was around 80 pips.
How Can Average True Range (ATR) Improve Your Trading?
You can use fewer than 14 days to accrue trading signals as a trader. This is because more extended periods will likely generate more periodic trading signals. For example, a short-term trader wants to evaluate stock volatility for five days.
The trader could have to estimate the ATR for the five days. Then, as prices are arranged in chronological order, the trader gets the absolute value at the maximum level at the current high minus the current low, the recent high less the preceding close, and the total value of the recent soft less the initial finish.
How to calculate ATR?
To calculate ATR, you need to find the difference between the highest and lowest prices for each bar for the observed period. For example, Daily ATR(14) will be the average distance between the highest high price and the lowest low price every day in the last 14 days.
Average True range = ATR = Average Sum (MAX (BarHigh, PreviousBarClose) – MIN (BarLow, PreviousBarClose))
You can calculate the average range stop loss as a Daily or Weekly ATR percentage. By default, ATR indicator settings are 14 days. However, in trading, some traders use 24 or 30 too.
What is ATR Trailing Stop or ATR stop loss?
ATR trailing stop or stop loss represents stop-loss price determination using the ATR indicator. Instead of a fixed number of pips, ATR stop loss is calculated based on current volatility. For example, if the average range for the last 14 days is 98 pips, a trader can set an automatically calculated stop loss to be 98 instead of using a fixed number of pips all the time.
Usually, ATR stop loss can be calculated based on percentages, allowing the trader to create various strategies (20% from Daily ATR stop loss, 50% from daily ATR stop loss, etc.).
Conclusion
The ATR stop loss indicator for MT4 is an exceptional tool for traders looking to manage their risk and trade with greater control. By analyzing the current volatility of an asset, the ATR stop loss indicator helps traders to identify the most appropriate stop loss position for a trade. This reduces the possibility of incurring losses and enhances the possibility of earning profits.
The indicator is simple to use and provides clear stop-loss values, making it easy to implement in any trading strategy. It also provides traders with a method for fine-tuning their trading plans, as they can adjust their stop loss levels based on current market conditions. Additionally, the ATR stop loss indicator can be used for all financial instruments, including forex, stocks, and futures, providing traders with a comprehensive solution for managing potential losses.

He is an expert in financial niche, long-term trading, and weekly technical levels.
The primary field of Igor's research is the application of machine learning in algorithmic trading.
Education: Computer Engineering and Ph.D. in machine learning.
Igor regularly publishes trading-related videos on the Fxigor Youtube channel.
To contact Igor write on:
igor@forex.in.rs
