Table of Contents
If you are in the financial market, you may probably know that price action is the most used stratify to gauge the exact movement of a financial asset. It doesn’t matter that you are a short-term trader or a long-term one; price action indicators are still crucial.
Trading using price action becomes very easy and still works like a charm whether it’s the stock market, commodity market, or forex market. If you have noticed, all the most used indicators are made up of price movements, and thus if you want to sustain yourself as a trader in the market, you need to learn them. We have covered all that you need to know about forex price action indicators, forex price action strategy, best price action indicator, and much more. Whether you are a novice or a professional forex trader, this would help you enhance your skills and brush up your knowledge.


What is Price Action?
Price action represents price movement that has aggressive initiation activity and strong price rejection of higher or lower prices. Usually, price action implies trading without indicators based on price levels and price movement analysis. However, modern trading strategies use pattern recognition indicators that can help in price action trading.


Price action patterns have 3 stages:
- Sideways price action area
- Aggressive initiation price activity
- Strong price rejection of higher or lower prices
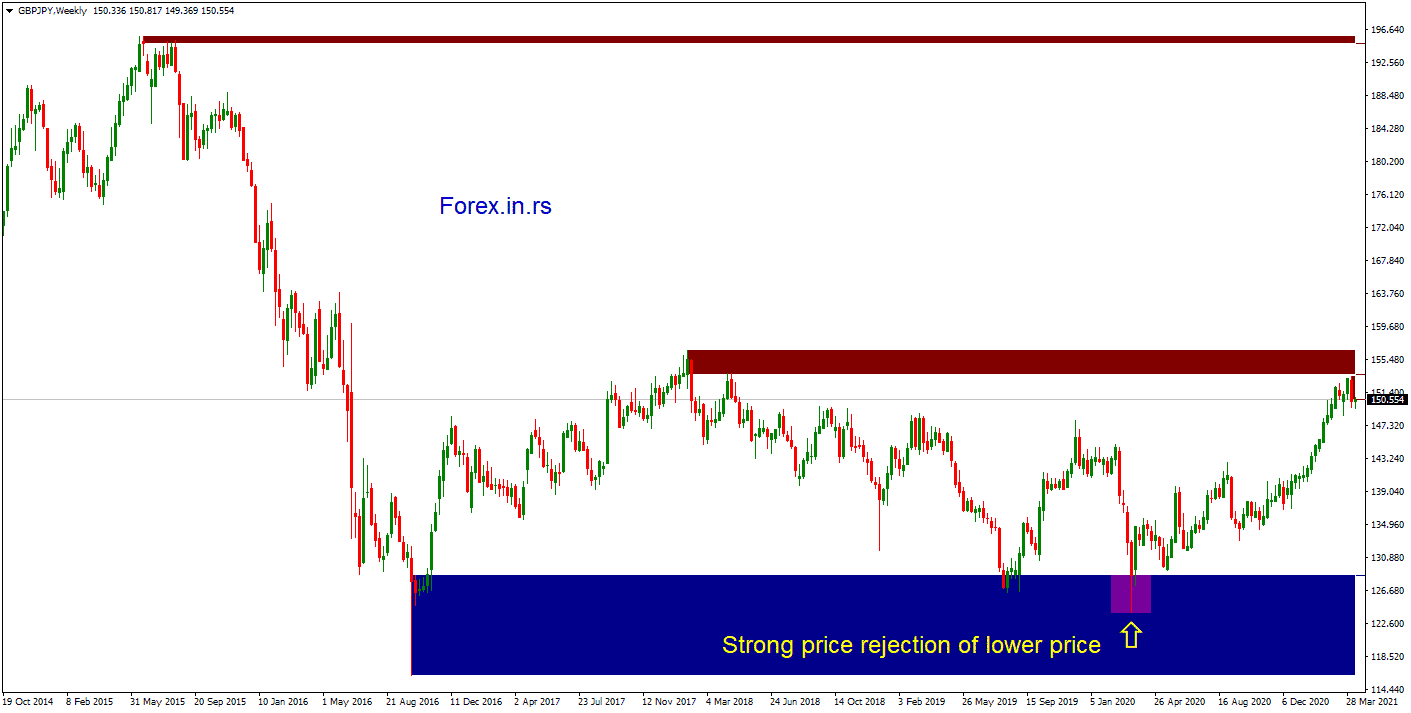
Price action example:
The price action example below shows a strong yearly support area (blue area). Price action is presented with a red candle with a long wick (yellow arrow on image).

In theory, an analysis of a financial asset’s rate movements is referred to as ‘price action.’ Market participants who use price action investing techniques search back in time and see any hints about where the trend may go now. The most popular price action metric is the analysis of price bars, including information like an asset’s opening and closing prices and even its high/low price points for a given time span.
The foundation of price action trading strategy is interpreting such data. In reality, in response to what actually is the price action, it’s possible to say – it is the analysis of the behavior of both market participants, aka buyers and sellers,s in a specific area of the market. Mostly, as a result, by evaluating what the other market players are really doing, participants may gain a distinct advantage in their investment choices.
Candlestick charts have been the most widely employed price points utilized as a price action predictor. Candlestick data analysis is available on any market site worldwide, demonstrating how common price action trading becomes.
Price action trading system
To create a price action trading system, you need to define support and resistance levels on the chart and monitor candlesticks with long wicks. In that case, you will analyze supply and demand zones and strong price rejection of higher or lower prices.
Step 1: Define important support and resistance levels. For example, you can download supply and demand indicators that will draw important price levels in MT4.
Step 2: Monitor candlesticks high and low in support and resistance area. Wait for fast and strong price movement (“price action”).
You can use various indicators that draw important price levels or analyze price volume and price movement.
We already recognize that price action is just the analysis of both market participants actively interested in a particular market, as mentioned earlier. A candlestick seems to be the most widely employed price action tracker because it provides traders with valuable details like stock prices and maximum and minimum price ranges over the desired timespan. Consider the following case:
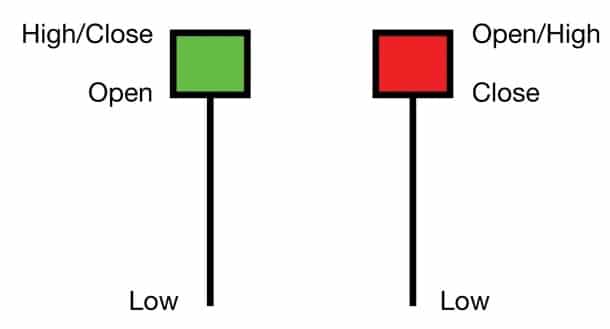
Two candles would show an entire day’s range of trades when you look at a regular chart of a company. Both candles provide traders with valuable data:
- The maximum and minimum price ranges indicate the trading day’s highest and lowest prices.
- A seller flame, which has a black or red frame, indicates that sellers prevailed during the trading day’s combat. When the close market price is much less than the starting price point, that’s the case.
- A buyer candle, which has a white or green frame, indicates that buyers have secured the trade war. Since the close price point is higher than those of the starting price point, this really is the case.
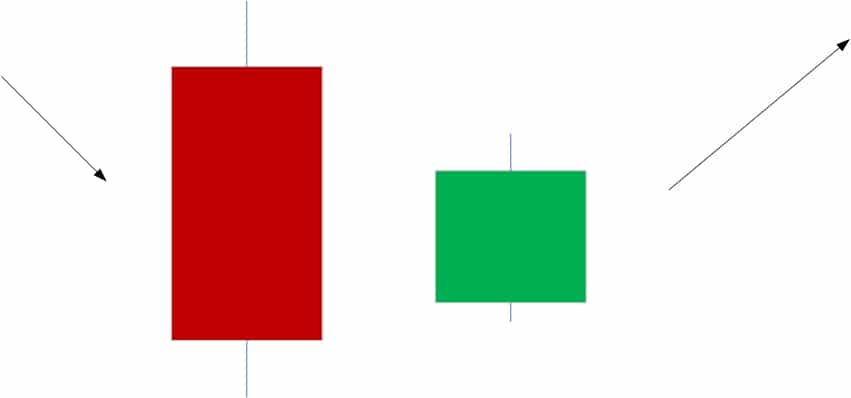
Among the first steps in developing a price, an action plan uses this basic candle system. Consider the following case:
- When the next candle follows the seller candle and creates a new bottom, it indicates that sellers are sufficient to retain, turning a profit. Any traders would take short /sell bets or keep short positions due to this downturn.
- When the next candle, just after the buyer candle, makes a new peak, it indicates that investors are likely to keep purchasing the stock. Any participants will take long /buy contracts or keep long positions they already have due to this strength.
Candlesticks could be used as a market action tracker in various ways, including this form of price action analysis. On the other hand, these same candles commonly shape trends that could be used to create market action trading strategies. Now let us try looking at where these trends function best before you dive at them.
Price action investing should be used on all stock exchanges, and it includes analyzing every one of the buyers and sellers. Forex, equity indexes, bonds, shares, and commodities are all examples of this. On candlestick graphs, users can see products in all of these assets and use a price implementation strategy.
The foreign exchange market, on the other hand, has several distinct benefits towards price action investors, like:
- A good representation for buyers and sellers amongst all nations, operates 24 hours each day, for 5 days per week.
- A high level of liquidity – allows you to move in and out of stocks in microseconds.
- Small spreads – many, although not all, foreign exchange currency pairs have small spreads that will help traders save money on commissions.
- Leverage – Since the currency market is a leveraged practice, one can manage a big position with just a limited initial investment. Kindly trade wisely, for it could result in major gains as well as significant losses.
Above are all just a few explanations that price action trading has become common in the foreign exchange market. Throughout the following segment, we’ll use the Foreign exchange market to illustrate four separate price action trading techniques. The first 3 price action trade techniques are appropriate for swing trading, while the last is appropriate for day trading, specifically scalping.
In the next part of this article, we will analyze price patterns, various candlesticks patterns that show fast price movement.
Price Action Forex Trading Strategies
A trading plan must include three components: How, What, and Why.
The fundamentals of your trading are the ‘how.’ In a nutshell, this is the way you’ll do trade. Such research entails understanding the entrance, stop-loss, and goal price ranges. And besides, investing is mostly about odds, and you’ll need to safeguard yourself and limit your risks if the market corrects against you.
The result of a trade is really the ‘what.’ What else would you try to get out of it? Would that be a longer or shorter transaction? It all leads to handling the transaction to profit and handling yourself when the result isn’t what you expected.
That ‘why’ seems to be the purpose you’re thinking about trading a market segment. Price behavior patterns are seen in this scenario. The price action research will give you an advantage in predicting when the stock would go forwards or backward soon.
Harami Price Action Strategy
Harami Price action strategy implies defining important price levels and then watching the harami candlestick pattern as an opportunity to enter into trade.
Harami is really a two-candle pattern that reflects market uncertainty and is mainly implemented for a breakout trade. It’s known as an ‘inside candle formation,’ since one candle develops within the spectrum of the prior candle, from top to low. This is an illustration of a bearish as well as bullish harami price action pattern.
Whenever the maximum and minimum ranges of a seller candle grow inside the high and low ranges of a prior buyer’s candle, the bearish harami candle is formed. It reflects market uncertainty, which might contribute to a downward reversal since no extension to shape a new peak is in view.
Whenever the maximum and minimum ranges of a buyer candle grow inside the high and low ranges of a prior selling candle, the bullish harami candle is created. It reflects sector uncertainty, which might contribute to a turnaround to the upward since no progression to shape a low point is visible.
The following is an overview of bullish as well as bearish harami price action patterns.
As such, a market action trading tactic, how can you execute such patterns? There seems to be no one-size-fits-all solution. Some traders, though, do this as an only breakout strategy. A few guidelines to consider:
Bullish Harami Pattern Trading:
- Recognize a bullish harami trend – the buyer candle’s maximum and minimum scale grows within a prior selling candle’s upper and lower zone.
- Place your order one pip well above the previous candle’s high point.
- Set a stop loss 1 pip just below the prior candle’s low level, and that would provide you with some space for your trade.
- Aim for a reward-to-risk ratio of 1:1, which implies you can aim for the same number of pips through entry to avoid loss.
- You should cancel the trade if the opening of a new candle has not triggered it. When the trade is already activated, retain this in the markets until the stop loss or trigger rates are met.
This is an illustration of the same.
Using the principle described, one should enter at a price higher than the last candle’s peak by having a stop loss just at the preceding candle’s bottom. When the order doesn’t really execute by the start of its next bar, a trader may easily cancel the contract and aim for another opportunity. If that has been activated, your stop loss or target rates would determine whether you make a profit or not.
The Bearish Harami Pattern Trading
- Recognize a bearish harami trend – the selling candle’s maximum and minimum range grows within the same prior buyer candle’s upper and lower zone.
- Place the order 1 pip just below the previous candle’s low point.
- Set a stop loss 1 pip just above the prior candle’s max level, which would provide you with some space for your trade.
- Aim for a reward-to-risk ratio of 1:1, which implies you can aim for much the same number of pips through entry to avoid loss.
- You should cancel the contract if the transaction has not been caused by opening a new candle. When the trade is already activated, retain that in the markets till the stop loss or the target rates are met.
The Hammer Price Action Strategy
Hammer Price action strategy implies defining important price levels and then watching the hammer candlestick pattern as an opportunity to enter into trade.
The hammer is a bullish price action candle indicator indicating a greater likelihood of the stock going higher than downward. It is almost always seen in rising markets. The below is an illustration of a hammer price action pattern strategy.
The price is being pushed to a new low by buyers. On the other hand, the buyers really aren’t powerful enough to hold the weak and opt to exit their shares. This leads the market to rebound, causing sellers to enter the market as well. Both the open/close price ranges of the candle would have been in the top half. The closing will typically be lower than the opening; however, it is the best indicator for price action if the closing is above the open price point.
The trend shows that a push upward is based largely on the open/close, high/low price points.
| The Entrance: | Whenever the next candle starts trying to smash the hammer candle’s high, it might be a good time to join a deal. |
| The Stop Loss: | The lowest of the hammer candle may be a potential stop-loss point. If another market spikes the entry price though no new buyers come, that indicates that the market will have to drop lower to get more buyers. As a result, the stop loss isn’t too near to the entrance. |
| The Objective: | There’s a whole range of methods to exit a profitable trade, including leaving on the closing of a pattern, hitting rates of support/resistance, or even using a trailing stop loss. |
The Shooting Star Price Action Strategy
The shooting star price action strategy implies defining important price levels and then watching the shooting star candlestick pattern as an opportunity to enter into trade.
The shooting star is a bearish trend that indicates that perhaps the price is more likely to move lower versus higher. The candle is almost always seen in down-trending environments. It’s also, in reality, the hammer’s exact opposite. The below is an illustration of a shooting star price action pattern.
The shooting star indicates that investors are driving the stock to new highs. The investors cannot maintain their spot at just the high and opt to exit those holdings. As a result, the demand falls, causing buyers to enter the market. That both opening /closing price ranges must be in the candle flame’s lower half. Closing will typically be higher than the opening; however, it is better if the closing is lower than the open price point.
The trend shows that a transition downward is likely based on the open/close, high/low price points.
Once the candles emerged in these cases, the price moved lower. But, this is not a promise.
| The Entrance: | Whenever the market actually begins to smash the lowest of the shooting star pattern, it might be a good opportunity to initiate a trade. |
| The Stop Loss: | A peak of the shooting star might be a potential stop-loss stage. |
| The Objective: | There’s a whole range of methods to quit a profitable trade, including leaving on the closing of a candle, hitting levels of support/resistance, or even using a trailing stop loss. |
Scalping Forex Price Action Strategy
For intraday traders, a range of foreign exchange price action scalping strategies remains accessible. On the other hand, Scalping needs additional filtering to sell a price action structure since it means making extremely brief trades several instances per day.
Finding markets that have been in a ‘trend’ will allow investors to figure out who is in charge of the demand – buyers/sellers! Moving averages are indeed a helpful trading tool for detecting that. Like the 20days and 50 days moving averages, quick-moving averages are widely used by scalpers searching for short-term movements.
Well, let’s make a few rules for a potential forex market action scalping strategy that utilizes moving averages to determine direction and price action to determine entrance and stop-loss points.
|
Buying Strategy |
Selling Strategy |
|
A 4-Hour Chart |
A 4-Hour Chart |
|
The 20 MA placed above 50 MA |
The 20 MA placed below 50 MA |
|
Bullish Harami pattern / Hammer |
Bearish Harami pattern / Shooting Star |
|
Price action appear between 20 MA – 50 MA |
Price action appear between 20 MA – 50 MA |
|
Enter- 1 pip above candle peak |
Enter- 1 pip below candle bottom |
|
Stop Loss- 1 pip below candle bottom |
Stop Loss- 1 pip above candle peak |
|
Aim- Prior swing high / pip risk (entry minus stop-loss rate) |
Aim- Prior swing/pip risk (entry minus stop-loss rate) |
|
Cancel the trade if not triggered by the start of a new candle |
Cancel the trade if not triggered by the start of a new candle |
This is merely an illustration that makes you curious about how to build your own price action forex trading strategy. Any approach would have effective and ineffective trades, so handle the risk accordingly.
The Final Thought
Price action trading is a versatile instrument that serves as the foundation for various techniques often used by traders worldwide. Isn’t it the time you tried using it in your buying and selling? There are going to be some ups and downs. You will win some trades and lose some, too. But that is part of the trading realm. We hope that this article has helped you to understand forex’s action price trading. All the best!

He is an expert in financial niche, long-term trading, and weekly technical levels.
The primary field of Igor's research is the application of machine learning in algorithmic trading.
Education: Computer Engineering and Ph.D. in machine learning.
Igor regularly publishes trading-related videos on the Fxigor Youtube channel.
To contact Igor write on:
igor@forex.in.rs
