Table of Contents
What is the Volume Weighted Average Price or VWAP, and how does it factor into your calculations as a trader?
First, the Volume Weighted Average Price is a purely day-trading phenomenon that can be used in various chart time frames.


What is the VWAP indicator?
Volume Weighted Average Price, or VWAP, represents a trading indicator that shows the average price, current book, and cumulative volume. To calculate VWAP, we need to add high, low, and close prices and divide them by 3. Next, we must multiply the average price by the volume and divide it by the cumulative volume.


Volume-weighted average price = (High+Low+Close)/3 x volume/cumulative volume
How to calculate Vwap in Excel?
In this video, you can see how you can calculate VWAP in Excel easily using the formula above:
How to Download VWAP and how to set up VWAP?

To set up VWAP, visit our page.
Additionally, you can download free VWAP indicators to download. Using other platforms, use the VWAP indicator from the Tradingview platform.
Vwap indicator for nifty
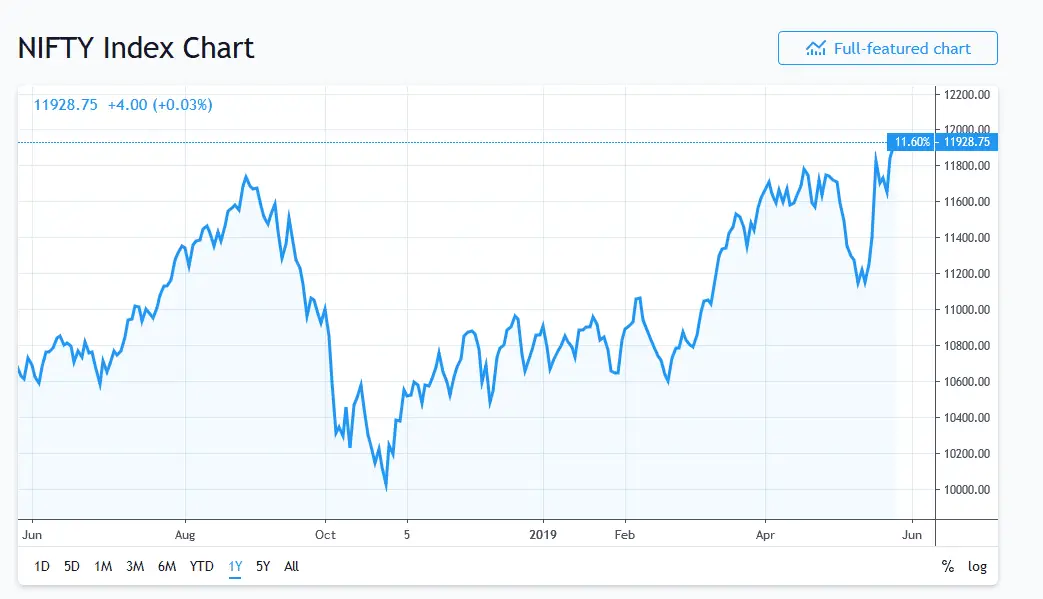
In the context of the Nifty, the VWAP indicator can be used to analyze the intraday price movement of the index. In addition, traders often use the VWAP indicator to identify potential buy and sell signals based on the price’s relationship to the VWAP line.
For example, if the price of the Nifty is above the VWAP line, it may be considered bullish, and traders may look for buying opportunities. Conversely, if the price of the Nifty is below the VWAP line, it may be regarded as bearish, and traders may look for selling opportunities.
Overall, the VWAP indicator can be a valuable tool for intraday traders looking to identify potential trading opportunities based on the intraday price movement of the Nifty. However, as with any technical indicator, it should be used with other analysis tools and risk management techniques to minimize risk and maximize potential profits.
How day traders use this is a metric for forecasting trends in the security’s value and determining any hidden value revealed by the trading activity, such as the security’s use in arbitrage and the like.
On financial charts, the Volume Weighted Average Price is denoted by a single line on intraday activity and shows movement in 1-minute, 5 minutes, 15-minute increments, and so on. Of course, how traders interpret this line is varied. Still, typically, a VWAP going up or above the VWAP line indicates that the security price will also move upward.
The NIFTY 50 index (futures or other) is India’s benchmark broad-based famous stock market index for the Indian equity market. However, many traders like to use VWAP for indexes and, therefore, NYFTY.
What is the VWAP trading strategy?
VWAP trading strategy represents a combination of VWAP indicators, other indicators, and significant price levels to define entry and exit trading positions.
VWAP Strategy – Volume Weighted Average VWAP Trading Price Strategies
The best VWAP trading strategy can be one of the following:
- VWAP system based on VWAP indicator and High and Low price levels
- VWAP and moving average strategy
- VWAP bounce strategy
- VWAP pullback strategy
- VWAP crossover strategy
- VWAP bands strategy – VWAP indicator and Bollinger Bands
- VWAP indicator and RSI
Let us discuss more :
- VWAP strategy based on this e VWAP indicator and High and Low price levels, traders use only the VWAP indicator’s previous high and low price as the primary trigger to enter or exit a trade. For example, BUY is the price is above the VWAP line and touches yesterday’s high, stop loss yesterday’s low, and target based on risk-reward.
- The VWAP indicator and moving average strategy: In the trend trading market, if the price is above VWAP, we can suggest that the price will continue to go bullish and, if it is below, go bearish. Of course, this way of trading is too simple, and VWAP can not predict the market.
However, in combination with VWAP bands and primary levels, we can see a better way of trading :
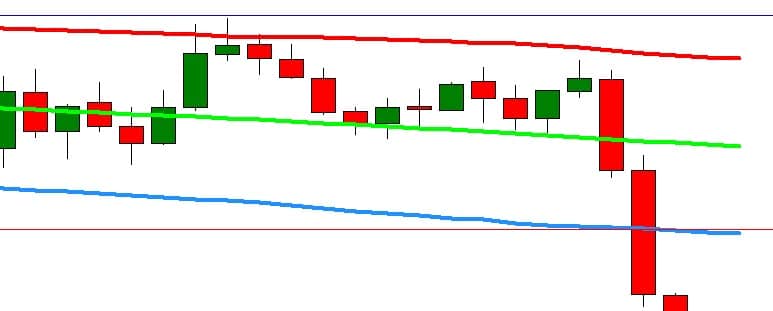
Critical levels and VWAP can give us better direction :
Conversely, a VWAP line below the VWAP typically indicates security with a falling price.
One can readily see how this information would be critical for day traders, particularly those making money through arbitrage.
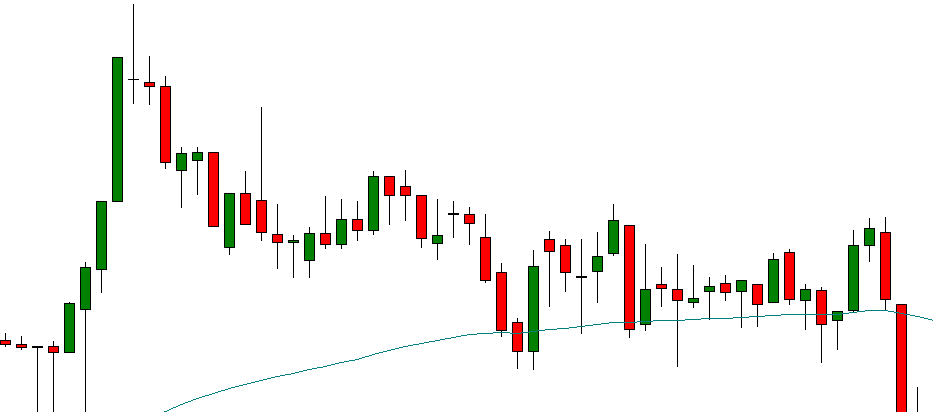
Volume Weighted Average Price VWAP strategy for NIFTY trading.
Our prop company uses the linear regression equation to calculate Target and Stop loss based on the Average True Range. In this example, we will put Daily ATR as the target and stop-loss, but you need to set your stop-loss and target level in actual trading conditions.
We created a strategy :
BUY, if essential, Fib. The level is touched, the price is above the VWAP line, AND the RSI index trend line is bullish. Stop loss is the last swing. Target is 1 Daily ATR.
SELL if important Fib. The level is touched, the price is below the VWAP line, AND the RSI index trend line is bearish. Stop loss is the last swing. Target is 1 Daily ATR.
We wrote an article about RSI and how to draw trend lines on the RSI indicator.
Results are :

VWAP Strategy Discussion
We use the system with a 1 to 1 risk-reward ratio on average in our strategy. We had 62% profitable trades for the last ten years. The most important criteria were the RSI trend line drawn manually on the chart and the VWAP indicator.
Typically, traders use the VWAP as a benchmark for whether or not they have paid too much for specific security (or if they have gotten a bargain). For example, if the security purchased is higher than the VWAP line, the trader may have paid too much; if the deposit is purchased at a lower price than the VWAP line, the trader might have gotten a more optimal price.
In practice, the VWAP might look like the moving average, but these two numbers are calculated in very, very different ways.
Calculating the Volume Weighted Average Price (VWAP) involves the security price multiplied by the number of securities traded divided by the total volume of securities.
A moving average is calculated by adding up closing prices during a specific time frame and then dividing that number by that time frame without regard for the trading volume. Volume can be used as a metric for measuring the liquidity in the market for a particular security.
As we described above, the VWAP has a variety of uses depending on the trader or institution.
For example, large institutional investors like mutual funds use the VWAP to determine when to enter and exit the market for a particular security, with as minimal disruption to that security’s price as possible. This has a modulating effect on the security price, pushing it back toward its average. When the price is below the VWAP, these funds will purchase it; when it is slightly above, they will sell it, all while minimally impacting the security’s moving price.
How to use the VWAP indicator in day trading?
VWAP indicator can be used in day trading to trigger entry into the trade. The best performance VWAP in short-time trading gives as a filter of high volume trades. Usually, traders avoid short-time day trading trades when the volume is too large because they can be closed too early. Thus, the VWAP indicator helps day traders filter high-volume trades and trade only during regular trading hours.
Conclusion
The most significant limitation of the VWAP is that it is a daily tracker. Extrapolating that information and mixing it with other VWAP numbers will give a trader little insight into security and may, in fact, vastly reshape the value of specific security for good or bad. Making decisions based on this erroneous information will not result in the optimal trades the investor seeks.
Moving VWAP is found by adding closing VWAP figures and averaging them over several periods. Moving VWAP is used by traders making long-term purchases and is not helpful for day traders or those who trade within very short intervals.
Because of its historical nature, VWAP is not valid for predicting future trends in isolation but must be used in concert with other metrics to make purchasing and selling decisions.

He is an expert in financial niche, long-term trading, and weekly technical levels.
The primary field of Igor's research is the application of machine learning in algorithmic trading.
Education: Computer Engineering and Ph.D. in machine learning.
Igor regularly publishes trading-related videos on the Fxigor Youtube channel.
To contact Igor write on:
igor@forex.in.rs
