Table of Contents
High liquidity in the forex market indicates the presence of buyers and sellers, enabling rapid and stable transaction execution. The depth of the market in forex trading suggests that participants are available to transact at slightly varying prices, ensuring even large orders can be smoothly filled. Major currency pairs, such as EUR/USD, USD/JPY, and GBP/USD, display higher liquidity due to the vast volume of trades, resulting in tighter spreads and minimized price manipulation.
Liquidity levels can vary throughout the day, typically increasing during the overlap of major financial markets like the London and New York sessions. Significant news events and economic reports can also influence liquidity, often introducing more volatility and broader spreads as traders react to new information. A liquid forex market is considered more stable and capable of absorbing substantial trades without significantly impacting market prices.


I know. The literature shows that high liquidity price levels are the best places for entry prices in trading. So, which indicators should we use?


The Best Liquidity Forex Indicators for MT4 and MT5 are supply-and-demand indicators and all indicators that mark previous highs and lows as potential high-interest price levels for traders—usually, yesterday’s low or high, weekly low or high, 50% Fib. Retracement or sessions low and high represent high liquidity levels.
Download the Supply & Demand Liquidity zones MT4 indicator.
Below, you can download the supply and demand zones indicator to find the best areas for high liquidity, draw basic price levels, and identify potential buy and sell orders.
Download supply and demand zones indicator
Previous Daily High and Low as High Liquidity Levels
In forex trading, the previous daily high and low are considered key levels of liquidity due to their significance as points of trader interest and market activity.

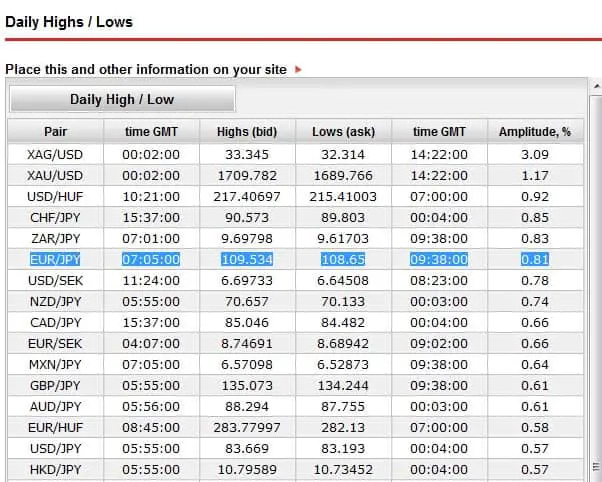
These levels represent a currency pair’s highest and lowest prices during the previous trading day. Here’s why they are associated with high liquidity levels:
- Psychological Significance: Traders often view these levels as benchmarks for the currency pair’s short-term potential and limitations. The daily high and low act as psychological barriers that traders anticipate might either be retested or held as resistance (high) or support (low).
- Price Reactions: As prices approach these levels, they attract increased trading activity because many trading strategies assume that these levels might either be defended or breached. Traders may place orders around these points to enter new positions or exit existing ones, expecting either a reversal or a breakthrough.
- Volume Increase: The increase in trading orders at these levels typically leads to higher volume, contributing to liquidity. This high volume is crucial for traders who need to execute large orders, as it allows them to do so without significantly impacting the price.
- Predictability: The previous day’s high and low levels provide a framework for traders to predict potential price movements. Many automated trading systems and algorithms use these levels to generate buy or sell signals based on historical price behavior, thus increasing trading activity and liquidity when these levels are approached.
- Stop-Loss and Take-Profit Orders: Traders commonly place stop-loss and take-profit orders at these levels. Concentrating such orders at the previous day’s high and low can lead to quick execution as prices hit these levels, further enhancing liquidity.
- Market Sentiment: These levels help gauge market sentiment. Failing to breach the previous day’s high might suggest bearish sentiment while breaking below the previous day’s low might indicate bearish trends. This sentiment analysis drives trading decisions, adding to the liquidity at these levels as traders align their positions with perceived market direction.
Supply & Demand Liquidity zones
Supply and demand liquidity zones in forex trading are areas on the price chart where significant buying or selling pressure causes the price to change direction dramatically. Supply zones occur where there’s strong selling interest, causing the price to drop as sellers outnumber buyers. Conversely, demand zones are where buying interest is strong enough to increase prices as buyers dominate. These zones are identified by observing historical price movements where the price has shown a sharp reversal; the areas just before these moves are considered potential supply or demand zones.
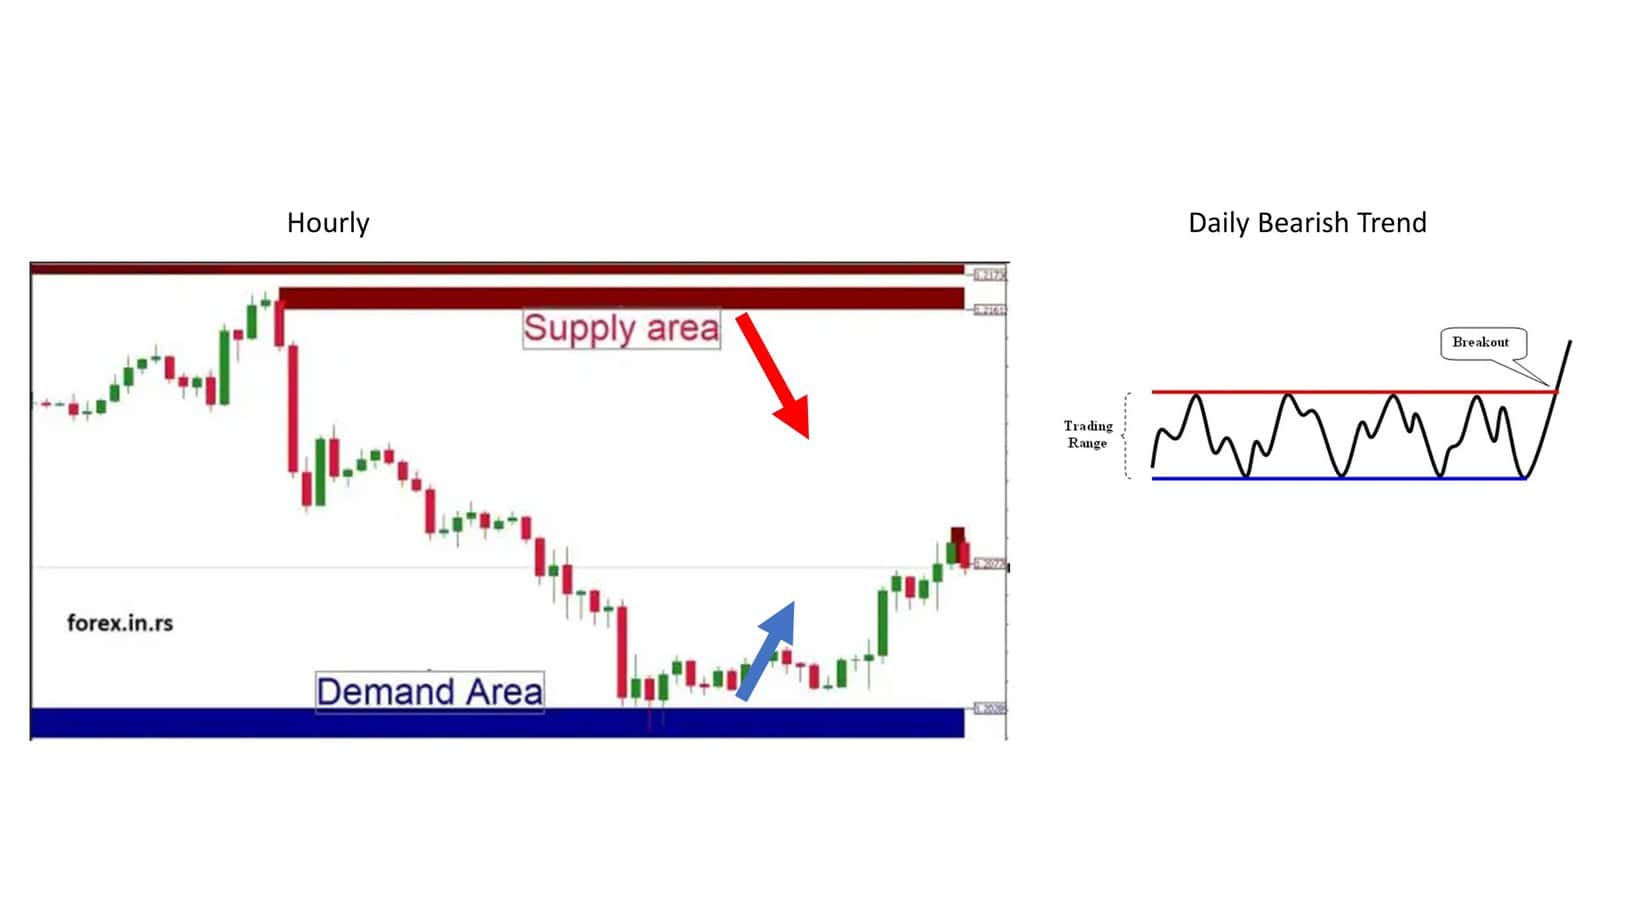
These zones are associated with high liquidity because they contain large volumes of pending orders, which get executed when the price returns to these levels. This high volume of orders, including clusters of stop-loss and take-profit orders, enhances liquidity. Traders often use these zones in their strategies by placing buy orders in demand zones and sell orders in supply zones, anticipating a price rebound. They also set stop-loss orders outside these zones to manage risk if the price does not react as expected.
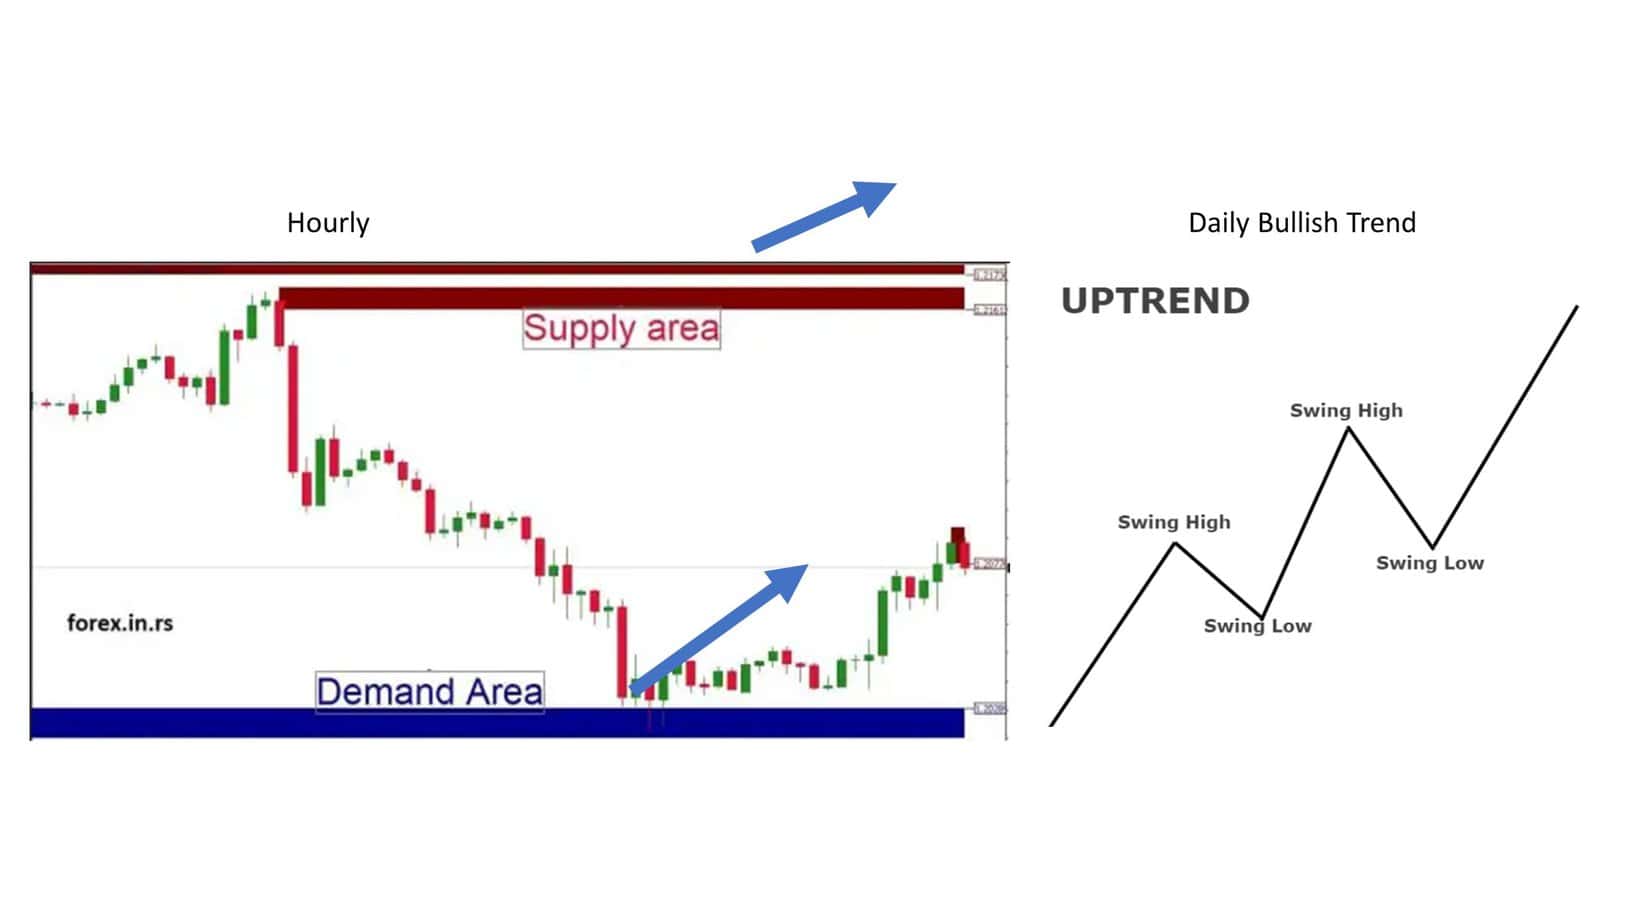
Supply and demand zones also carry a psychological element, as traders expect the price to behave as in the past when it reaches these points again. However, it’s important to note that these zones are dynamic; they can change as new market data becomes available, requiring traders to continuously update their charts and strategies based on the latest information. This dynamic nature ensures supply and demand zones remain relevant and integral to forex trading strategies.
Previous Session Low and Highs as Liquidity Zones
The highs and lows from previous trading sessions, such as the Asian, European, and U.S. sessions, serve as essential liquidity zones. These price levels are significant because they mark the extremes reached during a specific session, capturing the peak and trough of trading activity for that period.
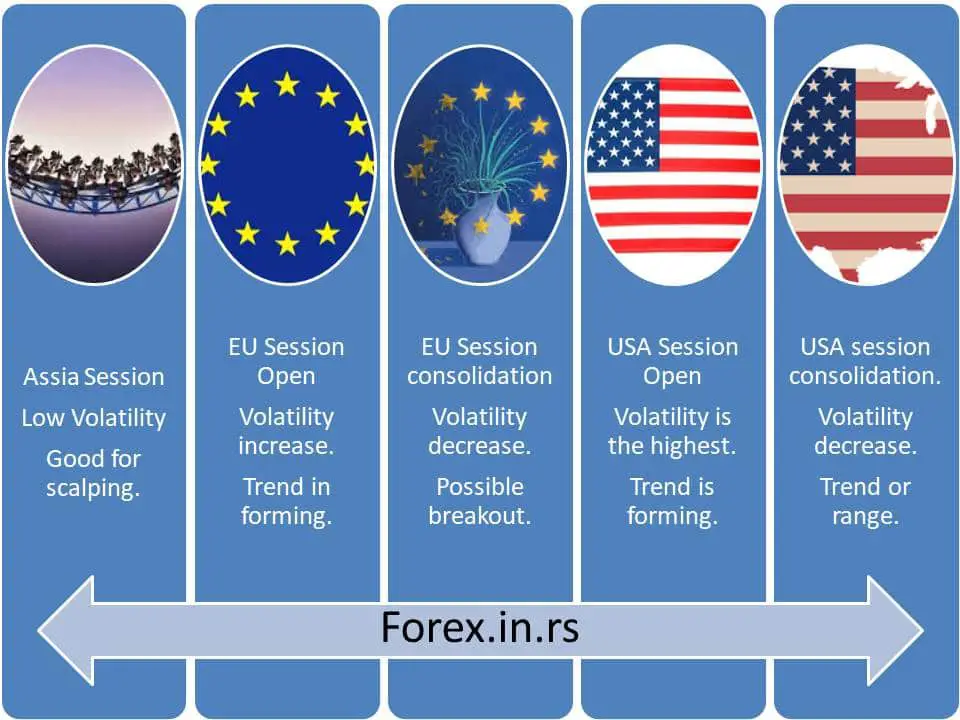
Traders pay close attention to these levels because they often act as resistance or support levels in subsequent trading sessions. For example, if the price approaches a previous session’s high, it may encounter selling pressure as traders anticipate resistance and may choose to take profits or initiate short positions. Similarly, if the price nears a previous session’s low, buying interest may increase, anticipating that the price will bounce off this support level.
These zones see increased trading activity as market participants place orders around these points, expecting the price to behave similarly to how it did in the past when it reached these levels. This concentration of trading interest increases liquidity, making it easier to execute large trades without significantly impacting the price.
Conclusion
High liquidity zones in forex trading are critical areas where trading activity is significantly concentrated, often around crucial price levels such as previous session highs and lows. These zones facilitate more effortless execution of large trades with minimal impact on the market price, ensuring more stable and predictable price movements. They also serve as focal points for traders to implement strategies based on expected price reactions at these levels, leveraging historical behavior as a guide.

He is an expert in financial niche, long-term trading, and weekly technical levels.
The primary field of Igor's research is the application of machine learning in algorithmic trading.
Education: Computer Engineering and Ph.D. in machine learning.
Igor regularly publishes trading-related videos on the Fxigor Youtube channel.
To contact Igor write on:
igor@forex.in.rs
