Table of Contents
Balance of power indicator
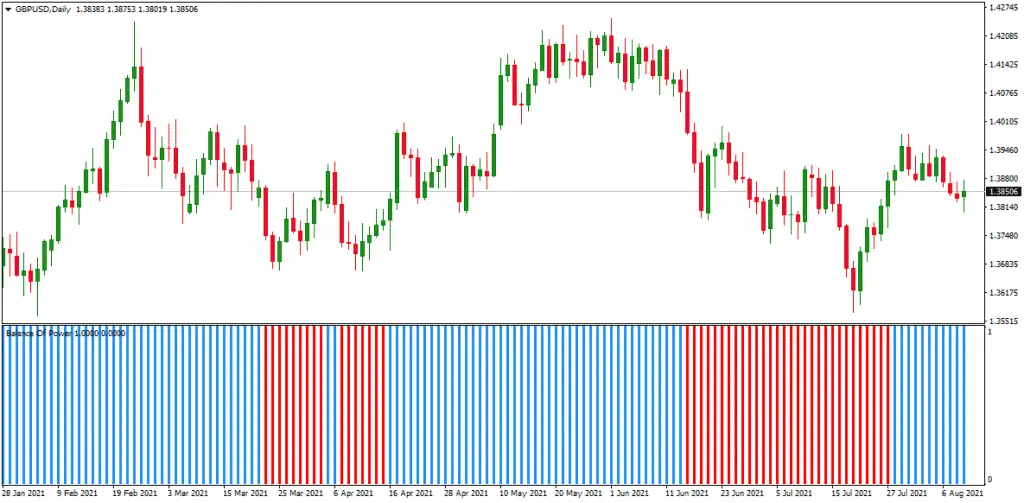
Balance of power indicator represents a simple trend indicator that measures the bullish potential of the asset (push prices to higher extremes) or bearish potential of the asset (push prices to lower extremes). BOP indicator shows the bullish trend (blue lines) or bearish trend (red lines).


Power Balance (BOP) is a generator that measures purchasing strength and pressure to sell. This indicator, presented to Igor Levshin in August 2001 in the Commodities and Stocks Technical Analysis Magazine, compares the buyers’ power to push up prices with the sellers’ strength to push down prices. The bulls are in charge of the indicator when the measure is positive. If the measure is negative, sellers will dominate. A read close to the zero line shows the two in balance and can convey a turnaround.


This indicator is also known as the Balance of Market Power (BMP).
Download balance of power indicator for MT4
Balance of power indicator strategy
Balance of power indicator strategy implies BUY signal when the overall trend is bullish (SMA is above 200 on the daily chart) and BOP indicator shows a blue color, or SELL signal if SMA is below 200 on the daily chart and BOP indicator shows red color.
Balance of power indicator can be useful and as BOP stock indicator. Balance of power stock indicator can be used as a bullish signal (blue color) or bearish signal (red color) in stock trading. Usually, this indicator mark stocks that are in the overbought or oversold condition.

BOP indicator Calculation
The original Livshin calculation method is reasonably complicated, But the formula is much simpler.
Of course, using these raw everyday values means an oscillator is choppy, and the rates are usually flushed with A moving average, which is a way to calculate this average. Livshin recommends smoothing using an SMA for 14 periods, although the time frame can be changed to match the time frame.
BOP indicator calculation formula = (Close – Open) / (High – Low)
The resultant indicator ranges from -1 to +1. A good value means open security; the higher the value, the greater the price increase. Thus, for each time included in the shifting average, the security is opening up at a value of +1 at a low and closed value.
The power balance indicator indicates the direction and scope of the change in price throughout trading. The Power Balance indicator can be used as most oscillators to identify trends, price differences, and conditions of overbooking/overbooking Crossings of the zero line offer signals for the purchase and sale.
BOP Zero-Line Crossover
The oscillator’s scale is -1 to +1, with 0 as its centreline. Zero-line crossovers indicate a shift into positive or negative areas, often used as buy or sell signals. A cross over the center line generates a purchase signal, and a cross below generates a sales signal.
To reduce the number of whipsaws, data is smoothed out. An SMA with additional periods decreases the number of false signals and the reaction rate of the indicator.
It can also be used to determine the trend, look for price divergences, and identify overbought/oversold securities.
Identification of Trends
An upward trend is shown with a rising BOP line and a downward trend with a falling BOP line. The null-line junction confirms the change in trend.
Price Differences
This is a negative discrepancy when new price levels are achieved, but BOP does not; when the price increases but BOP does not, the disparity between prices is positive. These differences can predict a trend change.
Terms and conditions Overbought/Oversold
Chartists must examine the historical security levels they are challenging to determine what should be considered oversold/bought for this security. Once these levels have been overbought/overbought for this security, then seek dips beyond them.
Conclusion
The power balance indicator (BOP) uses the price of purchase and sale pressure to measure. The strength of buyers and sellers is determined by considering how much the price has changed instead of using volume.
The BOP indicator Zero-Line Crossovers can be used as a signal to reverse the trend. In addition, the current price trend and the possibility to change prices can provide indications of indicator trends, price differences, and extreme overbought/oversold levels.
The balance of energy indicators should be used by dealers in conjunction with other indicators and analytical techniques, as with all indicators.

He is an expert in financial niche, long-term trading, and weekly technical levels.
The primary field of Igor's research is the application of machine learning in algorithmic trading.
Education: Computer Engineering and Ph.D. in machine learning.
Igor regularly publishes trading-related videos on the Fxigor Youtube channel.
To contact Igor write on:
igor@forex.in.rs
