Moving averages are essential tools for traders in the forex and stock markets. They provide a smoothed representation of price trends over a specified period. By averaging the prices of securities over recent days, such as with a 7-day moving average, traders can more easily identify the direction of the market’s momentum.
This method helps filter out the noise from short-term fluctuations, offering a clearer view of whether to buy or sell based on the trend’s strength and direction. Utilizing moving averages also aids in determining support and resistance levels, which are critical for setting strategic entry and exit points. As traders integrate these averages into their strategies, they can enhance their decision-making processes, potentially leading to more consistent and profitable outcomes.
The 7-day moving average represents a technical analysis chart line that calculates the average price of a security over the most recent seven days, smoothing out price data to identify trends. To calculate it, you add up the security’s closing prices for the last seven days and then divide by seven, giving you the average price for this period.


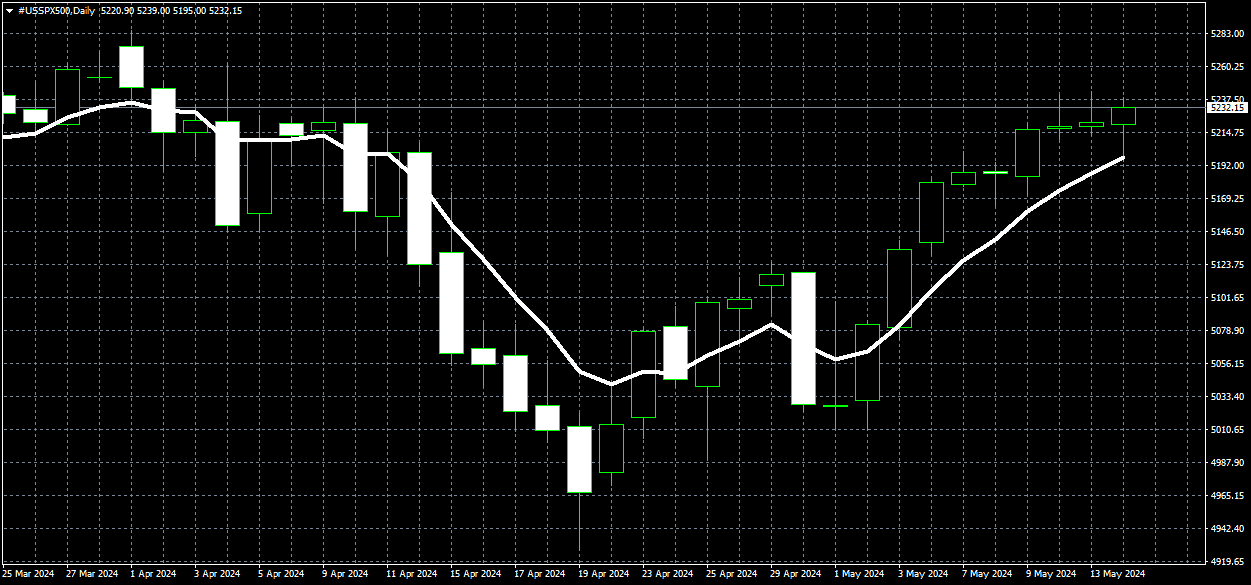
For example, on the chart below, we can see how 7 days moving average represents excellent support for a bullish trend:


In trading, the 7-day moving average is used by traders to establish strategic stop loss and target levels, ensuring risk management and profit maximization.
When a security’s price falls below its 7-day moving average, it often signals a potential downtrend, prompting traders to set stop losses below this level to protect against further losses. Conversely, if the price consistently rises above the 7-day moving average, traders might set their targets where they anticipate resistance, potentially locking in profits as the trend continues.
This moving average also helps define support and resistance levels; support is typically identified when prices stop falling and bounce back up from the moving average. Conversely, resistance is where prices top out and begin to fall after touching the moving average. By carefully analyzing these interactions between price and moving average, traders can make more informed decisions about when to enter or exit trades, enhancing their trading strategy’s effectiveness.

When using the 7-day moving average in trading, traders must combine this technical tool with economic data and fundamental analysis to make informed trading decisions. The 7-day moving average alone provides an edge by smoothing out short-term price fluctuations and helping identify general trend directions, which can improve the risk-reward ratio of trades.
However, without incorporating economic indicators and fundamental company data, traders might miss broader market shifts or underlying financial conditions that could affect the security’s performance.
For example, economic reports, earnings announcements, and changes in fiscal policy can significantly impact market prices and trends, influencing the effectiveness of technical indicators like moving averages. Thus, the 7-day moving average should be part of a comprehensive trading strategy that thoroughly analyzes market trends and fundamental economic factors. This holistic approach enables traders to better time their entries and exits and strategically manage their positions to balance potential rewards with associated risks.

He is an expert in financial niche, long-term trading, and weekly technical levels.
The primary field of Igor's research is the application of machine learning in algorithmic trading.
Education: Computer Engineering and Ph.D. in machine learning.
Igor regularly publishes trading-related videos on the Fxigor Youtube channel.
To contact Igor write on:
igor@forex.in.rs
Related posts:
- Smoothed Moving Average vs. Simple Moving Average
- Moving Average High Low Indicator- Download Moving Average Channel Indicator MT4!
- Hull Moving Average Best Settings! – Hull Moving Average Strategy Example!
- What is Moving Average?
- Two Period Moving Average
- What is the Best Moving Average for Volume Chart?
- The Best Moving Average for 5 Min Chart – Case Study with Video
- What is the 200 Day Moving Average or 200 MA?
- Moving Average Deviation Indicator
- Best Moving Average for 4 Hour Chart
- Volume Weighted Moving Average Indicator
- Download Zero Lag Hull Moving Average with Arrows
