Traders and investors benefit immensely from indicators. Each indicator has its USPs that make it unique. The AD indicators (Accumulations/Distribution indicators) are focused on the volume and the price of a stock. This type of cumulative indicators aid traders to assess whether a stock is distributed or accumulated. It helps them in identifying if there are divergences between the volume flow or price of a stock. This ultimately allows traders to analyze the strength of a trend.
One of the most popular AD indicators of all time is the Williams AD Indicator. It gives you the total buying pressure (positive accumulation values) and selling pressure (negative distribution values). Let’s explore what this indicator offers and how you can employ it while trading.
What is the Williams AD indicator?


Williams’ Accumulation/Distribution or Williams AD Indicator represents a trading indicator that sums up positive accumulation values (buying pressure) and negative distribution values (selling pressure) to determine market sentiment and strength.


Download Williams AD indicator
Finding Accumulations and Distributions Using the WAD

Before we understand how you can use the WAD to check for accumulations and distributions, let’s read more about this indicator and the meaning of accumulations and distributions in trading.
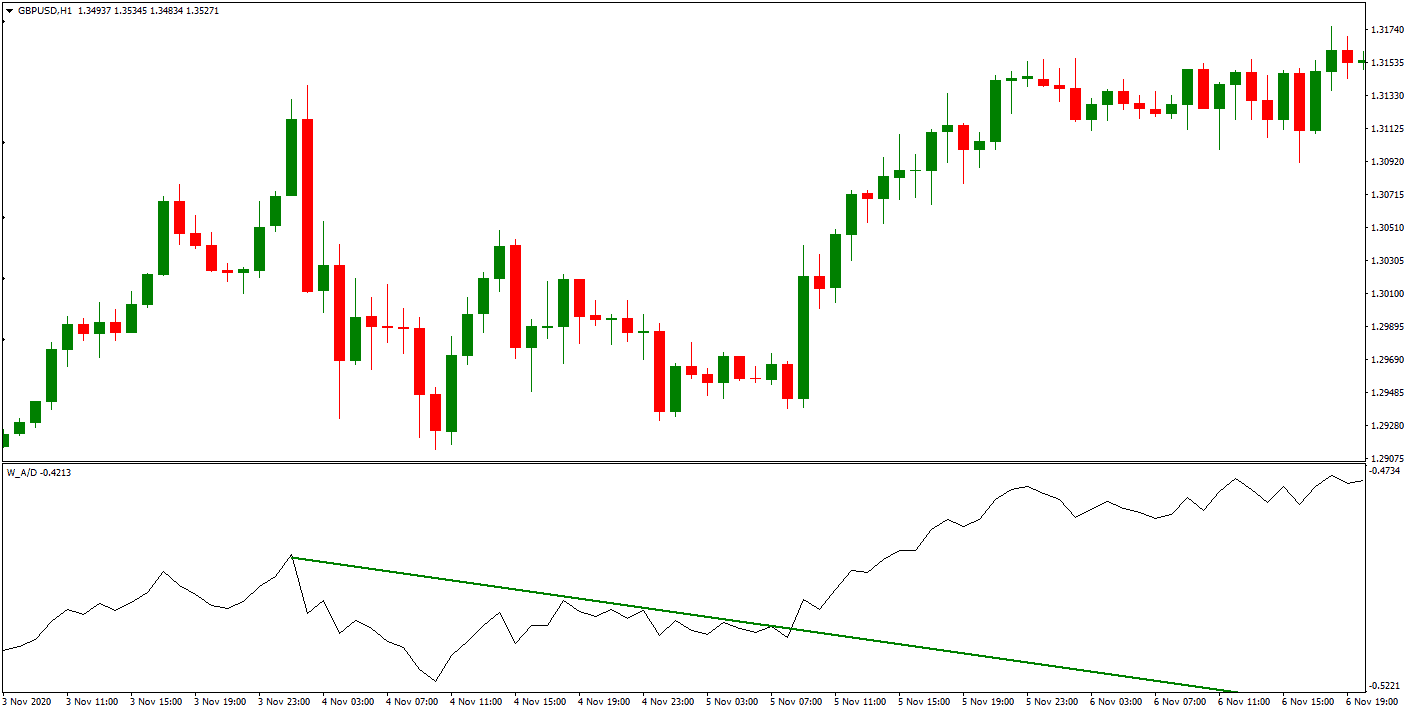
The WAD: Larry Williams developed the Williams AD Indicator. As opposed to the Chaikin AD indicator, which is based entirely on the volume and price data, the Williams AD Indicator measures the market pressure. It is traded on divergences. Divergences help us in checking if there is an uptrend or a downtrend. They can also tell us about a possible reversal. They are a part of technical analysis.
Accumulations and Distributions: When buyers control the market, this is called accumulations. Similarly, when sellers control it, it is called distributions. Accumulations occur in two cases – either the volume increases along with the closing prices moving hire or negligible price movement but an increase in the volume after a downwards trend. The two conditions for distributions are – either the volume increases but the closing prices move lower, or there is negligible price movement but an increase in the volume after an upward trend.
This is how you can use all three things together:
- When the indicator falls short while trying to exceed its previous high as the price makes a new high, we say distribution.
- When the indicator cannot make a new low as the price makes a new low, we say that accumulation.
How to Use the Willians AD Indicator to Find Trading Signals?
The main objective of using any indicator is to provide trading signals to the traders to make their journey easier. The WAD is no different. You can use it to spot trading signals and decide whether you want to go long or short. This is how a majority of traders make decisions using this indicator:
- If they detect a bullish divergence between the security price and the Willian AD Indicator, they open a long position.
- If they detect a bearish divergence between the security price and the Willian AD Indicator, they open a short position.
Using the WAD is fairly easy, and the following example will make it crystal.
You can look at the Commonwealth Bank of Australia (CBA), available online. Williams Accumulation Distribution is used to plot it.

He is an expert in financial niche, long-term trading, and weekly technical levels.
The primary field of Igor's research is the application of machine learning in algorithmic trading.
Education: Computer Engineering and Ph.D. in machine learning.
Igor regularly publishes trading-related videos on the Fxigor Youtube channel.
To contact Igor write on:
igor@forex.in.rs
