Table of Contents
Marc Chaikin created the Chaikin money flow indicator to calculate the money flow of securities over 21 days. The leading indicators for this indicator are the price and volume. Traders have the power to find out if investors are collecting an asset by buying it or letting go of it by selling it. By recognizing the movement’s flow, traders can quickly find the price change and determine price reversal. You can download Chaikin for free and use it to trade in any currency.
What is Chaikin Money Flow Indicator?
Chaikin money flow indicator represents an oscillator that detects trend shift. If the value is above 0, then the trend is bullish and if it is below 0 trends is bearish.


Download Chaikin Money Flow Indicator for MT4 below:


How to use the Chaikin Money Flow Indicator for trading?
The theory behind this indicator is that when the market strength goes high, the price for securities is close to the upper side of half. On the other hand, a falling market is determined when the market closes in the lower half of the normal range. Hence, it is a market trend indicator.
If the asset goes beyond the high trading session, the value will be increased. Conversely, the value decreases when the asset closes near low trading sessions.

The range of this oscillator is between 1 & -1. If the value is positive, the market goes through a bullish intent. In the other manner, if the value is negative, it goes through a bearish movement.
Chaikin Money Flow Buy signal
If the indicator reads above the zero line, it indicates a bullish market. This establishes that the market is positive, and you should enter a buy position. However, keep in mind that the indicator’s value is also increasing with the price. This bullish pressure is an indication of the accumulation of assets.
Chaikin Money Flow Sell signal
If the indicator is negative, it is a sign of market-facing bearish conditions. Hence, it would help if you sold your assets. Here also, the indicator will fall as the prices go down. Selling pressure is directly proportional to distribution.
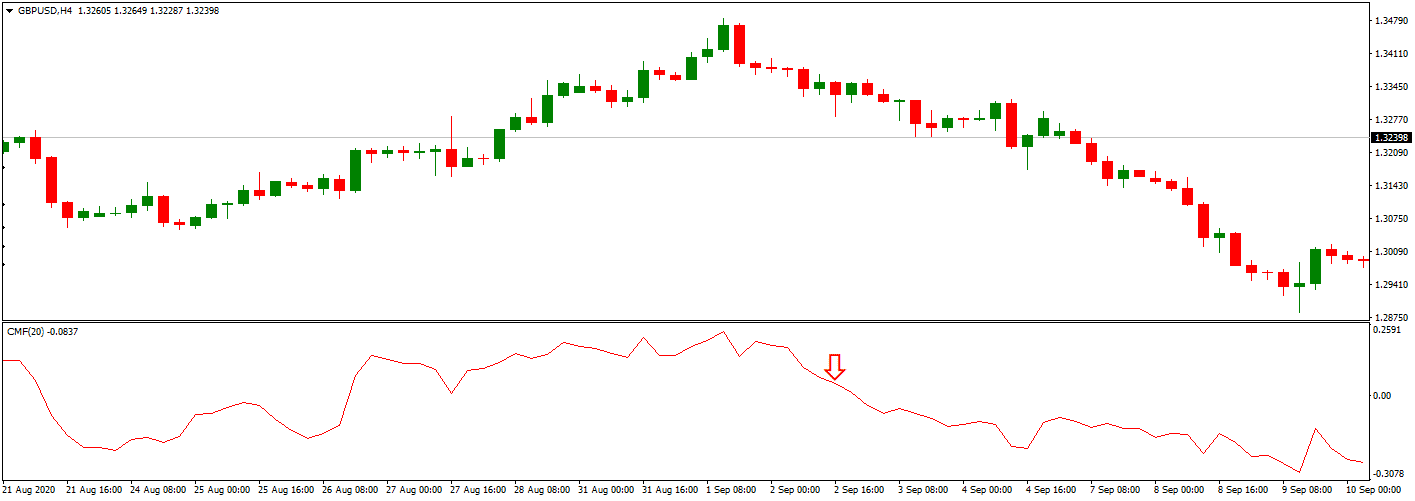
Example through a chart
This is an example of a chart where the indicator measures the GBP’s movement with the US dollar, and the time frame stands at four hours. A red circle is an indicator of price movement in bearish conditions. When the price falls, the indicator will become negative to positive. If the candlestick closes when the session is low, it indicates plummeting values.
Similarly, when there is an upwind in the market, the indicator value will increase. Due to the rising indicator line, the prices will close around the session high. Moreover, if the indicator moves over to a high value, the price will be near the resistance levels.
Conclusion
If you are trend trading, this is one of the most reliable indicators. It tells the situation when the traders buy and accumulate assets or sell and distribute them. Hence finding the robust nature of a trend. It can also help you recognize the chances for a trend reversal. This Chaikin indicator also works best when combined with other indicators or tools.

He is an expert in financial niche, long-term trading, and weekly technical levels.
The primary field of Igor's research is the application of machine learning in algorithmic trading.
Education: Computer Engineering and Ph.D. in machine learning.
Igor regularly publishes trading-related videos on the Fxigor Youtube channel.
To contact Igor write on:
igor@forex.in.rs
Related posts:
- Chaikin Volatility Bands Indicator – Free Download Chaikin Volatility Indicator
- What is The Money Flow Index MFI indicator?
- Download Half Trend Indicator MT4
- Trend Dashboard Indicator MT4 Download – Forex Dashboard Free Download
- MBFX Timing Indicator – Free download MT4 Indicator
- Download Elliott Wave Indicator
- Download Buy Sell Magic Indicator MT4
- Download MACD Divergence Indicator MT4!
- Download Swing ZZ MT4 indicator
- RSI Filter Indicator – Free Download
- Download ADX Histogram Indicator
- FX Vortex Indicator Free Download
