Table of Contents
Qualitative Quantitative Estimation is an indicator function on the model of enhanced RSI with the help of the smoothing technique. In relation to most of the indicators, QQE stands victorious in the test of volatility even during the financial crisis of 2008.
Download QQE Indicator!


How does QQE Indicator work?
- Indicator Calculates the 14-period RSI.
- QQE indicator calculates RSI by taking the 5-period EMA of the RSI.
- The indicator calculates the absolute value of the bar-to-bar change in the smoothed RSI.
- QQE uses a 27-period EMA to the values in step 3.
- QQE draws the slow trailing line by multiplying the result of step 4 by 4.236.
How to use QQE Indicator?
You can use the QQE indicator to find trend reversal, to spot overbought or oversold price levels. QQE indicator you can use exactly as RSI indicator. however, the QQE indicator is a little bit slower and smoother the RSI which is its biggest advantage to avoid false signals.


- Trend trading
You can use this indicator to find the ongoing trend in the market. If you witness the indicator is above 50 levels, it signals towards a bullish market. Hence, you should buy it. Hence, you can utilize this indicator in the form of a trade filter by taking a long position above 50 levels and a short position below 50 levels.
- Overbought and oversold positions
This indicator also helps to find if a security is overbought or oversold. For instance, if the indicator is beyond 70 levels, it shows that the market is going strong and is ideal for taking a long position. If the indicator moves at the contrary levels, you should take a short position.
- Divergence
This versatile indicator also helps to find the prices and momentum divergence. For example, you will find bullish divergence in the market when QQE settles at higher lows, while prices are stuck at lower lows. This is a sign of an incoming bullish reversal.
On the other hand, a bearish divergence occurs when this indicator is forming lower highs, while the price settles at higher highs.

When the bold line of the indicator crosses the trailing line, it is a signal of shifting momentum. If the bold line moves beyond the trailing line, it is a sign of bullish momentum. On the other hand, if the smooth line moves below the trailing line, it is an indicator of downward momentum.
QQE SELL TRADE Example
For example, when you are monitoring the movement of euros against the dollars in a daily frame. The green line indicates the movement of the price. If this line is moving upwards, the price is also rising. It is also a sign of a downward price movement. You will notice that the price also takes a reverse turn after coming to an overbought or oversold point.
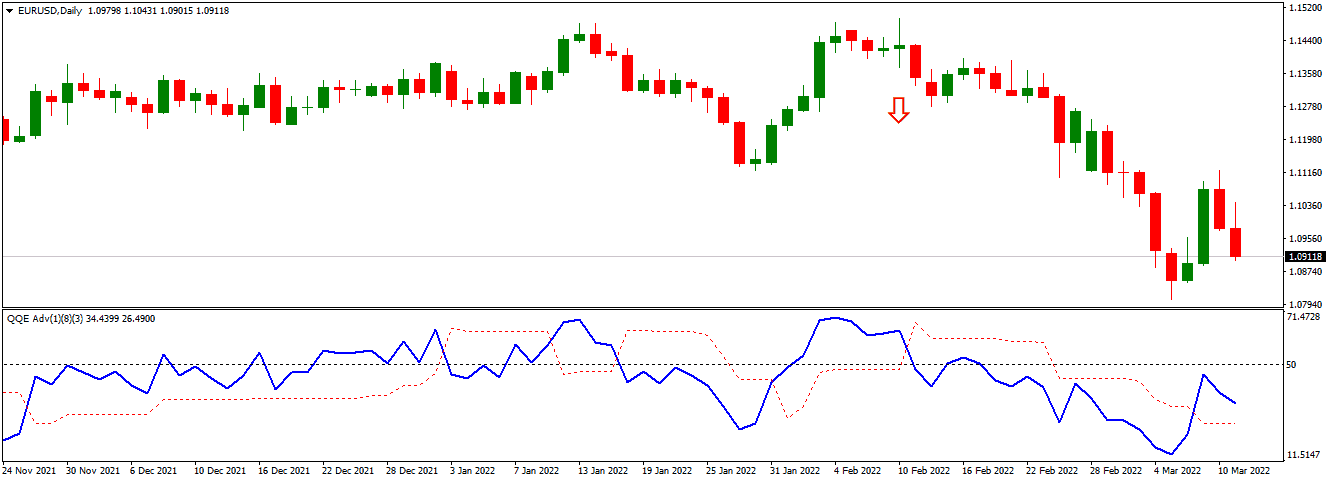
If the green line intersects the red line and moves below this lagging red line, the indicator will give you signals to sell. In the same way, if the green lines move beyond the red line during the upward movement of the price, the trend will prevail instantly after the lines cross each other.
Final Thoughts
The QQE indicator is a versatile and accurate indicator that provides a plethora of options to use for buy and sell signals. You can determine the possibilities of trend reversals and trade at profitable positions. Hence, it is prudent to use this indicator in the trading strategy.

He is an expert in financial niche, long-term trading, and weekly technical levels.
The primary field of Igor's research is the application of machine learning in algorithmic trading.
Education: Computer Engineering and Ph.D. in machine learning.
Igor regularly publishes trading-related videos on the Fxigor Youtube channel.
To contact Igor write on:
igor@forex.in.rs
