Table of Contents
In previous articles, we learn everything about RSI.
What is a 2-period RSI strategy?


Two-period Relative Strength Index (RSI 2) represents a mean-reversion RSI strategy where traders buy assets below RSI value 10 and sell when RSI value above 90. Larry Connors creates this aggressive reversal strategy.


Trading rules:
BUY if Daily RSI(2) below 10 AND Daily SMA >200
SELL if Daily RSI(2) below 90 AND Daily SMA<200
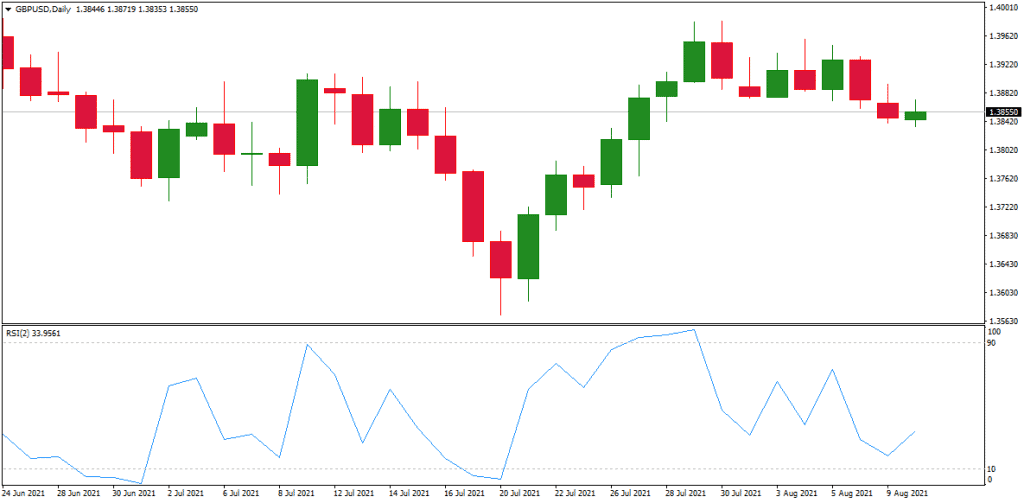

It is most beneficial for traders to look at avenues to buy when the 2-Period Relative Strength Index is below 10; it is deemed as deeply oversold at this point. On the contrary, a trader should sell when the 2-Period Relative Strength Index passes 90 marks.
This strategy is short-lived for recent trends; it follows the aggressive approach but is not viable for the long term. However, understanding this strategy will enhance and refine the application and implementation of method while trading.
The specifics of the strategy
This strategy is concluded in 4 steps.
- The first step entails the trader identifying the trend that is ongoing by implementing a long-period moving average. 200 days is preferable, as recommended by Larry Connors. As mentioned above, traders should consider buying avenues when the 200-day SMA is downward, while selling should be considered at an above 200-day SMA.
- The second step includes determining the buying and selling opportunities in the more widespread trend. This was done when Larry Connors experimented and observed the Relative Strength Index level from 0 to 10. This concluded that the 0-10 level is for buying options and 90-100 is for selling; these levels were based on the prices that appear after the close. When tested, Larry Connors found that the level below 5 gave higher returns than the level below 10. To explain this further, a lower Relative Strength Index means higher returns on long positions, and for short coverings, it was deemed beneficial to sell at a hike more than 95 than at the level above 90.
- The third stage in the process entails the actual sell short buying and selling and its time placement. Chartists who watch the market can define the position in two situations, before closing and subsequent opening. Larry Connors was a supporter of the close tactic. However, it is debated that before the closing, the traders might depend on the following open, which would include a gap. This opening can either benefit the trader or tumble down his position with a dramatic price change.
- Larry Connors used the example of S&P 500 to explain the fourth stage, where the goal is to decide the exit point. Through this, Larry Connors advised traders to exit before long positions are above the 5-day SMA and short positions are below the 5-day SMA. Chartists can also implement the Parabolic SAR or set up a trailing stop. Sometimes these trends take over the trailing stops; in this case, it ensures that the position is secure until the trend exists.
However, Connor does not advise using these stops. Why is it so? An observation held amongst thousands of traders brought the result that the stops were bringing unfavorable results regarding stocks and stock indices. Using these steps can prevent dramatic losses and big reductions in profits but keep in mind that the market also has upward drifts. These propositions are quite risky, but trading is an uncertain business. If you choose to indulge in it, some risks have to be endured sooner or later.
An instance of trading
In a chart of 200-Day SMA, the bullish signal appears when DIA is beyond 200-Day SMA, and Relative Strength Index(2) is moving 95 or higher. On the other hand, the bearish signal appears when the DIA is below 200-Day SMA, and the Relative Strength Index moves downwards at 5 or lower. If we consider an example where there are three bearish and four bullish signals over 12 months, this is a sign of a profitable situation. Among the three bearish signals, DIA moved lower only at one point, and it moved above the 200-Day SMA in the 10th month. After reaching above the 200-day SMA, the 2-Period Relative Strength Index should not move 5 or below it to create a new buy signal.
As a second example, we can consider that a company is trading above 200-day SMA for most of the timeline. During this time, there are at least 10 buying signals. It would be considered tedious to avoid losses during the initial five stops if the trader zigzags during a period. However, the other five can be profitable if it zigzags later in the year. To put it plainly, it can rebound after reaching the new lows after buying it initially.
What is tweaking?
Anyone should try to observe the strategies and find the signals where improved results can be derived. The secret to avoiding key fitting; it is meant to decrease your profits in the near time. As the example shows, the Relative Strength Index(2) strategy is implemented early because of the pre-existent moves before the signal. This security continues to move after the Relative Strength Index(2) moves beyond 95 or goes below 5. Chartists should scour for hints that prices have reversed after the Relative Strength Index(2) has hit the extremes to amend this scenario. The various techniques used in this situation include candlestick analysis, momentum oscillators, intraday chart patterns, or moves to Relative Strength Index(2).
When the Relative Strength Index(2) charges above 95 during upward price movement, this establishes a treacherous short position. The chartists can enable filtering of these signals by monitoring the Relative Strength Index(2) to go below 50. This indicates that the prices have made a short turn.
Conclusion
The Relative Strength Index(2) strategy helps the traders be aware and take part in the ongoing trends. According to Larry Connors, traders should purchase the pullbacks and not the breakouts, and this strategy works in favor of that.
Larry Connors predicted that stops would adversely affect the profits, but creating an exit and stop-loss strategy for the trading system is advisable. Traders can use this article to augment or modify their risk-reward choices, trading style, and personal judgment.

He is an expert in financial niche, long-term trading, and weekly technical levels.
The primary field of Igor's research is the application of machine learning in algorithmic trading.
Education: Computer Engineering and Ph.D. in machine learning.
Igor regularly publishes trading-related videos on the Fxigor Youtube channel.
To contact Igor write on:
igor@forex.in.rs
Related posts:
- Two Period Moving Average
- The Best Divergence Trading Strategy
- What is ADX indicator? – ADX Trading Strategy
- Average Collection Period Interpretation
- 200 EMA Stochastic Strategy – EMA 200 Strategy!
- Engulfing Trading Strategy – Case Study
- Keltner Channel Strategy
- Awesome Oscillator and MACD Strategy! – Awesome Oscillator vs. MACD
- What is Narrow Range 7? – NR7 Strategy
- MACD and Bollinger Bands Strategy – BB MACD Tutorial
- How Does the Relative Strength Index work ?
- The Best 4h Trading Strategy
