Table of Contents
As we know from previous posts, one of the best MACD indicators for MT4 is two lines and one histogram. This indicator better represents the trend change and enables traders to understand the cycles of changing bullish and bearish trends. Traders can download MACD indicator MetaTrader 4 with two lines for free: 2 line MACD indicator for mt4 free download.
To use the MACD indicator correctly, use the MACD MT4 2 lines indicator.


On the other side, the awesome oscillator is a histogram trading indicator that compares the current 5 bars with the 34 bars of the broader trends based on the Awesome oscillator formula. The Awesome Oscillator is created to detect the bearish or bullish trend.– Awesome oscillator mt4 download.


With these two indicators, traders can use one common strategy – MACD and Awesome Oscillator Strategy.
Awesome Oscillator and MACD Strategy
MACD and Awesome Oscillator Strategy represent strategies where traders enter a BUY position when a bullish MACD crossover occurs, and both histograms are bullish (green color). Conversely, the SELL position will be made when a bearish MACD crossover occurs, and both histograms are bearish (red color).
To learn about the best MACD settings, visit our page.

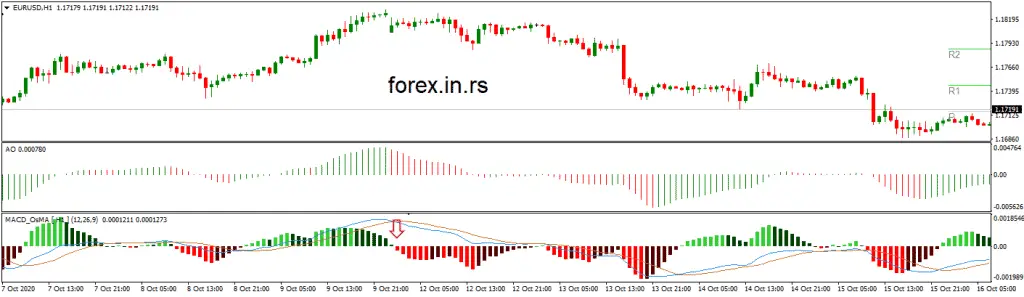
As we can see on the H1 chart for EURUSD, at the moment when MACD two lines make a bearish cross, we have a red arrow. At that moment, both histograms show red downside color. This simple strategy you can combine with other price action patterns, divergence, etc.
Stop loss and target can be created using daily ATR (from half to 1 Daily ATR, for example) or FIb. Levels.
Two oscillators, such as MACD and awesome oscillator, can usually be used when traders want to create an additional filter, to avoid false breakout or overtrading.
Technical analysis is an essential tool for traders and investors to make informed decisions in the financial markets. The Awesome Oscillator (AO) and the Moving Average Convergence Divergence (MACD) are two popular indicators used in technical analysis. This article will delve into the features, calculations, interpretations, and differences between these two indicators, enabling you to understand their strengths and weaknesses.
Awesome Oscillator (AO)
The Awesome Oscillator is a momentum oscillator that helps identify the potential direction of a trend. Developed by Bill Williams, it aims to detect the driving force behind price movements. It is based on the difference between a 34-period and a 5-period simple moving average (SMA) plotted on a histogram.
AO Calculation:
- Calculate the 34-period SMA: (High + Low) / 2 for each candlestick.
- Next, calculate each candlestick’s 5-period SMA: (High + Low) / 2.
- Calculate the AO: 5-period SMA – 34-period SMA.
AO Interpretation:
- When the AO is above zero, it suggests bullish momentum, indicating that the short-term SMA is higher than the long-term SMA.
- When the AO is below zero, it indicates bearish momentum, implying that the short-term SMA is lower than the long-term SMA.
- The cross above or below the zero line can be considered a signal for potential trend reversals.
MACD
Moving Average Convergence Divergence (MACD): The MACD is a trend-following momentum indicator that shows the relationship between two moving averages. Gerald Appel developed it and uses a combination of exponential moving averages (EMA) to generate signals.
MACD Calculation:
- Calculate the MACD Line: 12-period EMA – 26-period EMA. Then, calculatee the Signal Line: 9-period EMA of the MACD Line.
- Finally, calculate the MACD Histogram: MACD Line – Signal Line.
MACD Interpretation:
- When the MACD Line crosses above the Signal Line, it generates a bullish signal, indicating a potential buying opportunity.
- When the MACD Line crosses below the Signal Line, it generates a bearish signal, suggesting a potential selling opportunity.
- The MACD Histogram represents the difference between the MACD and Signal Line. Positive histogram values indicate bullish momentum, while negative values indicate bearish momentum.
Awesome Oscillator vs. MACD
Differences between Awesome Oscillator and MACD:
- Calculation: The AO uses simple moving averages, while the MACD uses exponential moving averages, making the MACD more sensitive to recent price changes.
- Signal Line: The MACD includes a Signal Line, a 9-period EMA of the MACD Line. The AO does not have a separate signal line.
- Zero Line: The AO uses a zero line to indicate bullish or bearish momentum, while the MACD uses the crossover of the MACD Line and the Signal Line for generating signals.
- Histogram: The MACD has a histogram component, indicating the difference between the MACD Line and the Signal Line, which provides additional insight into momentum shifts.
- Interpretation: While both indicators aim to identify momentum and potential trend reversals, the AO is more straightforward, focusing on the relationship between short-term and long-term moving averages, while the MACD incorporates multiple components for a more comprehensive analysis.
Conclusion: The Awesome Oscillator and the MACD are popular indicators that help traders analyze price momentum and potential trend reversals. The AO is more straightforward and clearly interprets bullish and bearish momentum based on moving averages. On the other hand, the MACD incorporates exponential moving averages, a signal line, and a histogram, providing a more detailed.

He is an expert in financial niche, long-term trading, and weekly technical levels.
The primary field of Igor's research is the application of machine learning in algorithmic trading.
Education: Computer Engineering and Ph.D. in machine learning.
Igor regularly publishes trading-related videos on the Fxigor Youtube channel.
To contact Igor write on:
igor@forex.in.rs
