This entire concept evolves from 1990 when Tony Crabel first published ‘Day Trading with Short Term Price Patterns & Opening Range Breakout.’ Even though this book isn’t available anymore, its ideology never fails to function in the current times. Not only the Narrow Range 7, but the NR4 is also well-known amongst traders of the short term.
These range days define the uncertain contractions and the unprecedented expansions happening across the day-to-day trading sector. Thus, it holds a fair share of similarities with the Bollinger Band Squeeze. These techniques are also helpful for trading indices, ETFs, and stocks, though the author used these for trading in futures.
If you wish to know more about this system, check out some great deals in this article!


Narrow Range Strategy
The narrow range strategy represents a trading strategy where traders enter into trades if the last candle has the narrowest range (narrow range candlesticks) in the previous X bars. For example, NR7 or Narrow range seven on the daily chart represents the bar with the tightest price range in the last seven days.


Download NR4 and NR7 indicator for MT4.
NR4, narrow range for the last 4 days represents the candlestick bar that has the minimal distance from daily high and daily low in the last 4 days.
NR7, narrow range for the last 7 days represents the candlestick bar that has the minimal distance from daily high and daily low in the last 7 days.

Tony had a different way of functioning than the others; as the others liked the percentage range more, he followed the market as per the complete range. But, in today’s times, as the four-day and seven-day trading window is used, there is not much of a difference. So, as per NR7 strategy, it begins with the range of the day, signifying the difference between the highs and lows.
The NR4 displays the lowest range across 4 days, whereas NR7 displays the lowest range throughout 7 days. Therefore, a procedure that can only be implemented for shorter and daytime trades was designed to trade as per the opening range breakout.
ORBs function according to the price ranges visible in the first 5 minutes of the trading period, which is a shorter term. If not this range, people can watch out for a breakout on the upper side, just when the prices are going upwards than the narrow range of the day. They can also look forward to the breakdowns occurring on the lower side when the prices are drifting below the narrow range of the day.
Since it is a short-term strategy, it needs to function as soon as the trade begins. If you’re not able to work with them, the first signal would be the lack of work towards the direction. Once you get the signal of buying, a step before the downfall of the narrow range will be showing the negative aspect. On the other hand, a step crossing the high levels of the narrow range will be signifying selling.
There is also a crucial requirement of consideration of the stop-losses and profit tarFor example, ints. For example, in Tony Crabel, profits were obtained rapidly, mainly before the first day of trading ended or towards the first profitable closure. But, you need to essentially remember that these strategies are only meant to be used in short-term trading, and there is no guarantee these might suit everyone.
Another option in the Narrow Day Trading System would be to take the profits from the resistance and put the percentage target. Then, in stop-losses, the chartists can utilize the Parabolic SAR to identify the base according to the Average True Range.
Narrow range SELL conditions :
- Ensure to set up the trailing stop-loss.
- Take note of both the NR4 and NR7 days.
- Sell during the move that’s below the narrow range day low.
Narrow range BUY conditions:
- Ensure to set up the trailing stop-loss.
- Take note of both the NR4 and NR7 days.
- Buy during the move that’s above the narrow range day high.
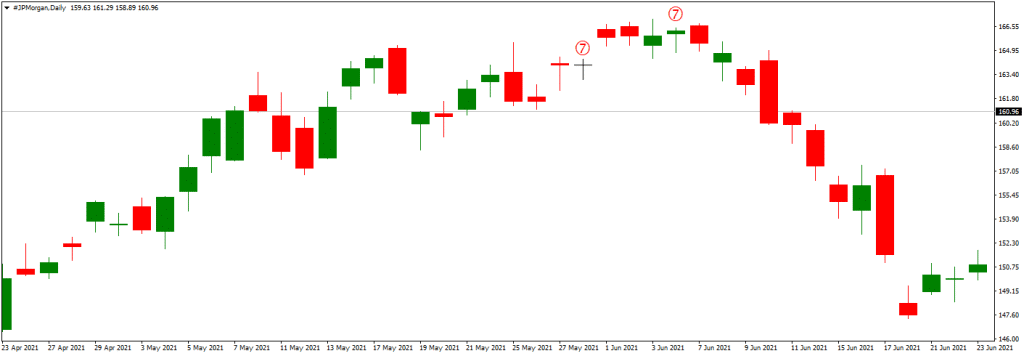
The instance features Morgan Stanley, holding 12 signals in a span of fewer than three months. The arrows in blue show the narrow range candlestick, and under it, the thin lines in blue display both the highs and lows of the range. The moves on the next day that are on a high are bullish, whereas the moves on the next day that are low are bearish. First, you must identify that the days of the NR7 are formed constantly across three different moments.
Though the situation might not always be the same, this one after the other moment of NR7 does not show different signals but displays the signal existing before the breakouts in NR7. However, traders might witness the price actions with close monitoring while judging and managing the stops with a cumulative number of nine signals.
In SharpCharts or TradingView they do not display the indicators that reveal the ranges of the day or show both the NR4 and NR7 strategy days. But, there might be a chance to scan these days with the Advance Scan Workbench by writing a code. With this option, the chartists can use an ATR of 1-period, estimating the range and bringing the NATR7 readings to light, displaying the all-time low across the seven days.
Despite this, NATR7 will not bring out very similar signals; they will still be overlapping the regular readings of NR7. Under the critical note, the Average True Range clearly displays the contraction and expansion of a range.
Several chartists will be looking forward to qualifying the NR7 signals, considering their high-level frequency. A regular stock will be bringing out several NR7 days throughout the 12 months, whereas daily scans of US stocks can return over 100 stocks along with the NR7 days. They can easily make an increment or decrease the Narrow Range Periods to bring out the results of their choice. As they go down from NR7 to NR4, there will be an increment in the number of stocks fitting into the criteria, but if they go up from NR7 to NR20, they’ll witness a downfall in the number of eligible stocks.
In simpler terms, the stock numbers that fit into the criteria will go up as the period decreases, whereas the number of stocks will decrease if the period increases. The chartist’s decision to add up other indicators of their choice to qualify the other signals present. Instead, it would be a great initiative to introduce a trend indicator along with an overbought/oversold indicator. Adding a trend indicator can witness the trades more extensively, whereas the oversold/overbought indicator saves the drawbacks.
The chart presented here is an example of Mcdonalds’ that displays a 1-period Average True Range, imitating NR7 signals. The Aroon Indicators visible are there to simplify the visibility of the more significant trend, and the Commodity Channel Index signifies the overbought and oversold situations. The bullish signal is visual when Aroon displays an uptrend, the CCI low is below 100 over five days, and the range shifts to a low in 7 days. Conversely, the bearish signal is visible when Aroon displays a downtrend, the CCI high is above 100 over five days, and the range is shifting to a low in 7 days.
Conclusion
The NR7 day concept is settled on the idea that the considerable expansion of the range also follows the range contractions. Therefore, the indicator that displays the future price direction always sums up to a neutral stage in this situation. Since NR7 ranges are smaller, the possibility of a whipsaw occurring is minimal but still feasible. Any breaks that are higher than the NR7 have a chance to be followed by the lower situation of NR7. But if you wish to use this strategy, always keep the good things in mind, note the bullish patterns, and follow the selling signals. These signals will be visible with a support test or a falling flag. Use this technique to identify your particular way of trading, your preferences, and your very own analysis.

He is an expert in financial niche, long-term trading, and weekly technical levels.
The primary field of Igor's research is the application of machine learning in algorithmic trading.
Education: Computer Engineering and Ph.D. in machine learning.
Igor regularly publishes trading-related videos on the Fxigor Youtube channel.
To contact Igor write on:
igor@forex.in.rs
