Table of Contents
In the world of investment, risk and return are inextricably linked. More often than not, higher returns come with a higher degree of risk. But is there a way to quantify this trade-off, to measure whether the potential reward justifies the inherent risk? The answer lies in the Sharpe Ratio, a vital financial metric that helps investors understand the reward-to-volatility ratio.


The Sharpe Ratio, developed by Nobel laureate William F. Sharpe in 1966, measures the performance of an investment compared to a risk-free asset after adjusting for its risk. Investors widely use it to calculate the risk-adjusted return and understand if the returns are due to good investment decisions or excessive risk.


Ratios are an essential part of the finance world. Ratios give predictions about many aspects of an investment. Thus, it helps the investor/trader to have a pre-trading insight into their planned investment. There are many types of ratios that investors and traders use. One such ratio is the Reward Volatility Ratio.
What is the Reward to Volatility Ratio?
The reward-to-volatility ratio or Sharpe ratio quantifies the extra return of the portfolio for each incremental level of risk undertaken. Therefore, it calculates the standard deviation of its risk-adjusted returns compared to a risk-free asset.
Reward Volatility Ratio, also known as Sharpe Ratio, named after its founder William F. Sharpe, is a ratio that investors use to compare the return of an investment with its risk. Since its creation in 1966, it has been in use and is of massive significance to investors.
The Reward Volatility Ratio helps investors calculate average returns that can be expected with zero or no risk taken. That means the trader can calculate the return gained without risk and formulate the investment plan according to the risk he is willing to take. In addition, with the help of this ratio, the investor can separate the profits that are a part of the risk-related activities.

Reward to Volatility Ratio Formula
Reward to Volatility Ratio =Sharpe Ratio = (Expected return of the investment – Risk-free rate) / Standard deviation of the investment’s returns
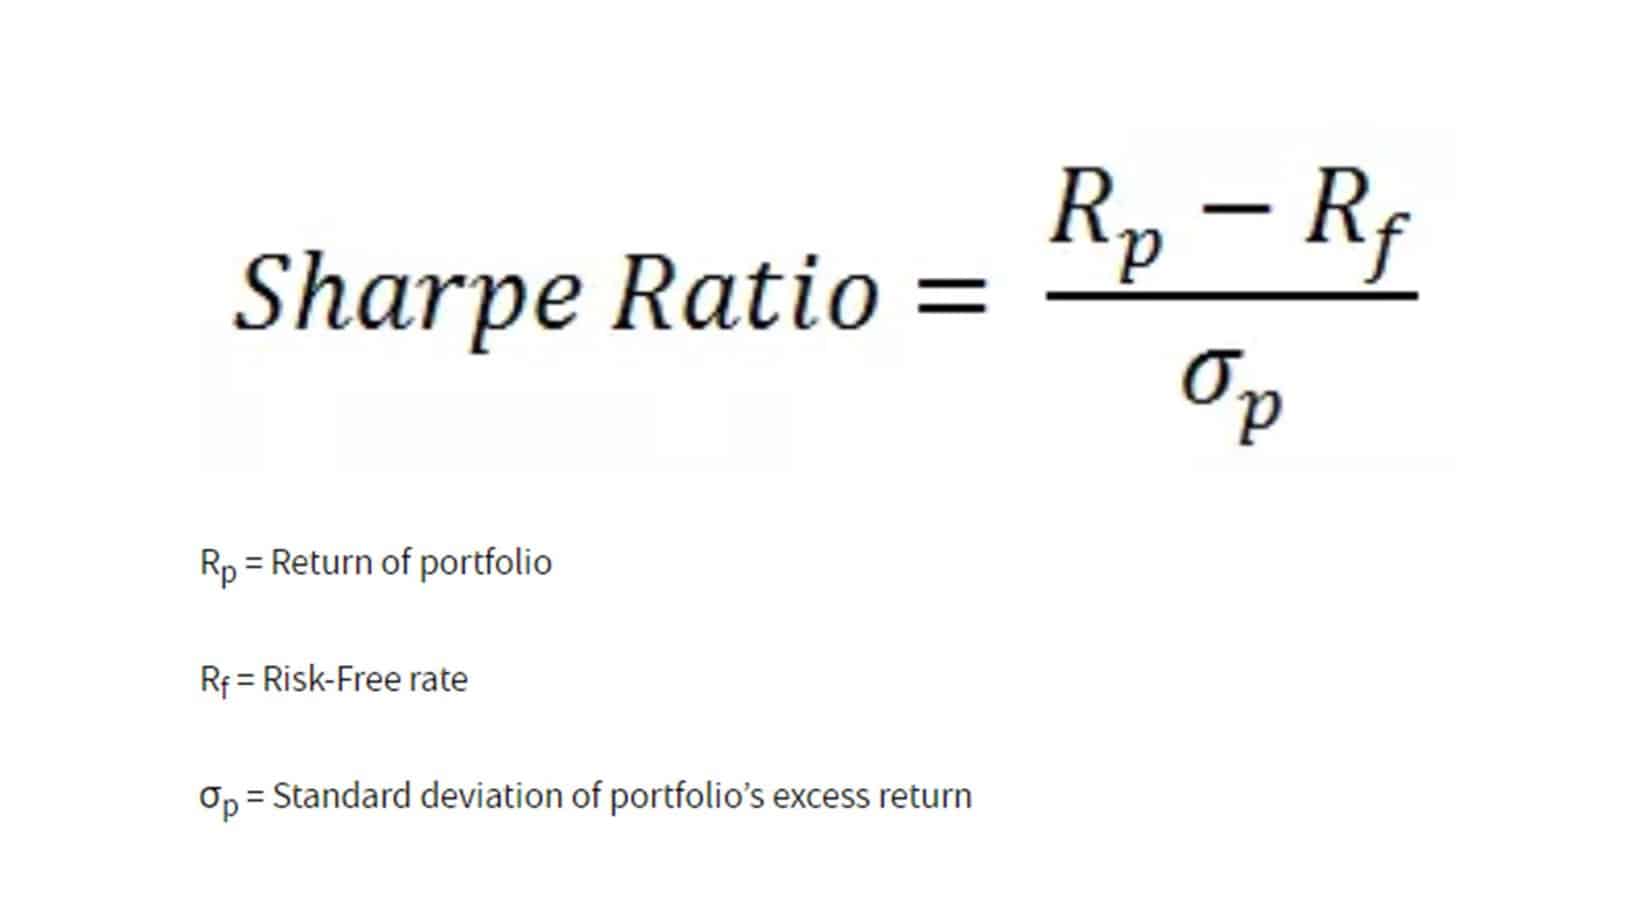
The elements of the formula are:
- The expected return of the investment: The return investors anticipate they will earn from the investment.
- Risk-free rate: This is the return from an investment considered to have virtually no risk, often taken as the yield on government securities like Treasury bills.
- The standard deviation of the investment’s returns: This measures the investment’s volatility or the degree to which the returns can vary from their average value.
The resultant figure measures the excess return per unit of deviation in an investment asset or a trading strategy, commonly called a risk-adjusted return.
A higher Sharpe Ratio indicates a more desirable or ‘better’ investment opportunity. If the Sharpe Ratio is positive, the investment returns are higher than the risk-free rate, adjusted for the risk taken. If the Sharpe Ratio is negative, the investment underperforms the risk-free rate. A Sharpe Ratio of 1 or more is considered good, two and more is very good, and three or higher is excellent.
However, like any other financial metric, the Sharpe Ratio has limitations and must be used and interpreted correctly. It assumes that the returns are normally distributed and the investment risk is symmetrical, which may not always be accurate. It also does not differentiate between upside and downside volatility.
Reward to Volatility Ratio Practical Example
Let’s assume that you have a Forex trading portfolio, and over the past year, you’ve made monthly trades and tracked their returns. You’ve calculated the following:
- Your Forex trading portfolio has an expected return (or mean return) of 14% per annum.
- The standard deviation of your portfolio’s returns (which quantifies its volatility) is 10% annually.
- The risk-free rate (from a 1-year Treasury bill) is 2% per annum.
We can plug these figures into the Sharpe Ratio formula:
Sharpe Ratio = (Expected return of the investment – Risk-free rate) / Standard deviation of the investment’s returns
Substituting the given numbers, we have:
Sharpe Ratio = (14% – 2%) / 10% = 1.2
In this scenario, your Forex trading portfolio’s Sharpe Ratio is 1.2. This means that, for every unit of risk (as represented by the standard deviation) you’ve taken on, you’ve achieved a 1.2% excess return over the risk-free rate.
How to apply the Reward to Volatility Ratio?
The Sharpe Ratio is a versatile tool used in many ways:
- Portfolio Performance Evaluation: The Sharpe Ratio helps assess the performance of a portfolio by adjusting for risk. It objectively measures how well the portfolio has performed relative to the risk taken.
- Asset Comparison: The Sharpe Ratio allows for easy comparison between different assets or portfolios. Even if two portfolios have similar returns, the one with the lower standard deviation and higher Sharpe Ratio would be the superior investment.
- Optimal Portfolio Construction: Modern Portfolio Theory utilizes the Sharpe Ratio to build portfolios that offer the maximum possible return for a given level of risk.
As a commonly used ratio by all investors, Sharpe Ratio comes in handy when an investor plans to add another asset or security to his current portfolio. It is stated that portfolios with diversified assets can decrease risk; the return is not sacrificed. One can also compare the past performance of the portfolio and the expected performance of the portfolio after adding the new assets. This could be understood with the help of an example.
The current portfolio (with bonds and stocks) comes with a return rate of 18%, and the risk-free rate is 5%. The standard deviation of return to the portfolio is 15%. So, this rewards us with a Volatility ratio of 0.86 or 86%.
After careful study, the investor finds out that adding the new asset or security to the portfolio will decrease the rate of return from 18% to 15%. Also, the portfolio reward volatility will drop to 10%. Assuming that the risk-free rate will remain the same gives us the Sharpe ratio of 100%, which is higher than the Sharpe ratio of the previous portfolio.
The above example shows that adding diversified securities to a portfolio may have decreased the absolute return. Still, it gave a boost to the performance based on risk adjustment. So, with the help of past and expected future investment figures, investors can compare the two and get an expected insight into the planned investment.
The Sharpe Ratio compares the previous and planned future investment decisions and helps review the current investment portfolios’ performance. The higher returns can result from two possibilities, i.e., too many risks are associated with the portfolio investment, or the investment decision was taken smartly. In any case, it is advisable to go for an investment decision not accompanied by elevated risks, no matter how promising the expected returns may look.
The Sharpe ratio can also warn investors about the losses that may occur with their planned investment. The portfolio’s risk-adjusted performance is directly proportionate to the Sharpe ratio: the higher the Sharpe ratio, the higher its risk-adjusted performance. The Sharpe ratio can also be harmful because of two possibilities. One, there is going to be a negative return from the portfolio. Two, the portfolio’s return rate is less than the risk-free rate.
Types of Reward to Volatility Ratio
Since 1966 the R to V ratio was introduced, and it has undergone many changes due to the dynamic environment. As a result, the investors can use two types of Sharpe ratios. These are:-
1. Treynor Ratio
Almost developed at the same time as the Sharpe ratio, the Treynor ratio also aims at calculating the risk-adjusted return of a portfolio, but in a slightly different way. Instead of the standard deviation of the returns, it uses the beta, which is the portfolio’s performance in correlation to other elements in the market. Simply put, it uses portfolio beta that exists because of market forces.
The above explanation gives us the formula,
[Portfolio Return – Risk-Free Rate] /Portfolio Beta
It is the best tool to understand your portfolio’s performance compared to other portfolios in the market. Investors can know if their respective portfolio is outperforming the market or not.
2. Sortino Ratio
The Sortino ratio is very different from that of the Sharpe and Treynor ratios. Instead of the standard deviation and portfolio beta in the Sharpe and Treynor ratios, it uses ‘the distribution of returns below the required rate’ as its base. Also, it does not consider the risk-free rate; instead, it is calculated by subtracting the required return from the portfolio return.
The formula for Sortino Ratio is, therefore,
[Portfolio Return – Required Return] Distribution of returns that are below target return
As a result of removing the standard deviation from the formula, this ratio eliminates the impact of the upward price movement.
Limitations to Reward to Volatility Ratio
Everything comes with drawbacks, and the Sharpe ratio is no exception. Even after being the choice of maximum investors, this ratio has certain limitations.
One of the limitations could be the possibility of receiving a negative Sharpe ratio. The reasons for such are discussed above. When this negative value approaches, the trader moves towards the 0 value of the ratio to get out of the negative impact. This could be done by increasing the returns, which are uncertain and cannot be controlled. So, this negative Sharpe ratio becomes useless as it cannot accurately study market conditions.
We all know that more trade opportunities will be available if we are willing to take risks. But the Sharpe ratio works on the logic that volatility equals risk. Therefore, the investor tries to increase volatility to face lesser risk, ultimately reducing the trading opportunities.
Conclusion
The Sharpe Ratio is an invaluable measure in finance, offering a clear perspective on an investment or portfolio’s risk/return trade-off. Financial analysts and investors widely use it to compare the returns of different portfolios while considering the associated risk.
The Sharpe Ratio simplifies investment decision-making by encapsulating risks and returns in a single number. However, it should not be used in isolation. A comprehensive assessment of any investment should involve multiple metrics to account for various risk and return factors.

He is an expert in financial niche, long-term trading, and weekly technical levels.
The primary field of Igor's research is the application of machine learning in algorithmic trading.
Education: Computer Engineering and Ph.D. in machine learning.
Igor regularly publishes trading-related videos on the Fxigor Youtube channel.
To contact Igor write on:
igor@forex.in.rs
