This indicator combines two indexes: ADX – Average Directional Index and DMI – Directional Movement Index. The DMI measures the trend direction, and the ADX measures the trend’s strength. Hence, integrating these two indicators offers the professional traders vital trend information. As a result, the oscillator ultimately gives trading signals while also displaying the trend’s strength.
For MT4, the DMI histogram with ADX Oscillator serves as a strong indicator, directional trend indicator, and indicator to measure the trend’s strength. This indicator can be used on any financial tool, such as indices, stocks, commodities, forex, and metals, and that too, at any period. Thus, intraday traders, swing traders, long-term traders, and short-term traders use this indicator to its full potential.
Download ADX Histogram Indicator
Download ADX Histogram Indicator


Trading signals in DMI ADX indicator
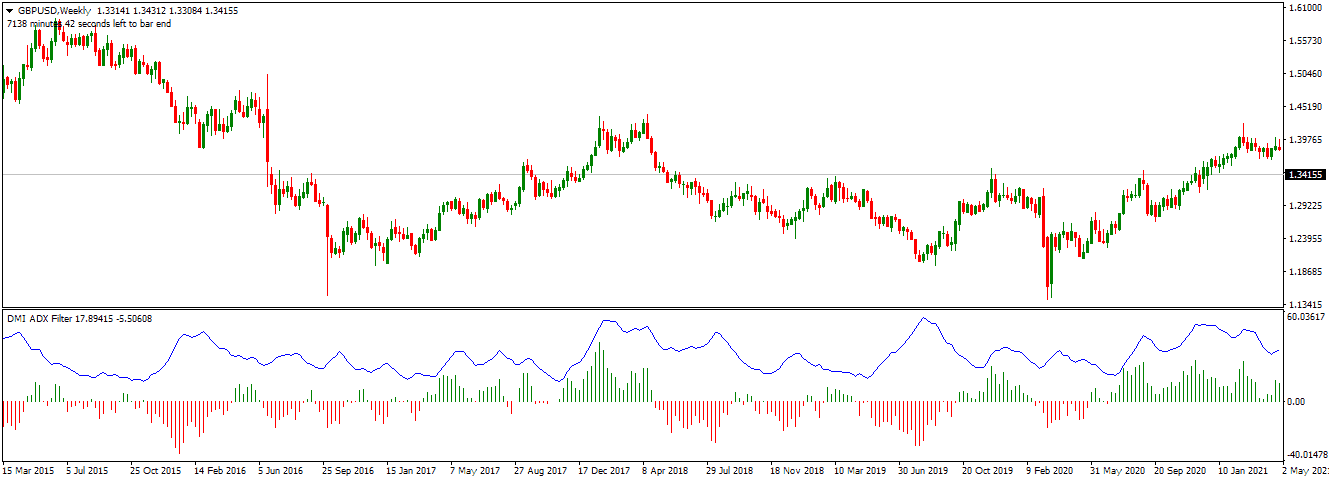
The DMI histogram with the ADX Oscillator indicator is illustrated using GBPJPY H4 charts. The variation seen between D positive and D negative is represented by the histogram, which substitutes the conventional indicator’s D negative and D positive lines. Forex market participants can merge the ADX line with the DMI histogram to validate the buy and sell signals.
The presence of a downtrend is indicated by the red-colored bars in the histogram, whereas the prevalence of an uptrend is indicated by the green-colored bars in the histogram. Traders can consider purchasing after the histogram’s color flips from red to green and is displayed beyond zero line. They can exit the trade when the opposite color appears. The traders can sell the position and exit the trade when the histogram’s color flips from green to red and is displayed beneath the zero line. However, the ADX line should be looked upon to determine trend strength and indicate early exit possibilities.
Divergence is among the finest trading approaches for this indicator. The difference between the actual cost and the histogram indicates early notifications of reversal and trend weaknesses. Divergence is widely accepted and is used as a primary indicator by forex traders. Thus, the DMI ADX indicator is the most acceptable indicator using divergence. On the other hand, trend direction and strength can be recognized with ADX lines and histogram bars.
New traders can benefit from the DMI and ADX combos because they can quickly see the intensity and direction of a trend. Simultaneously, expert traders can combine the indicator with different indicators to form complicated technical investment approaches.

The Bottom Line
Like the ADX MT4 – Average Directional Index, the MT4 indicator can recognize trends; thus, it is a popular indicator amongst forex investors. In addition, it is commonly regarded as an excellent trading instrument for the forex market by traders. The inclusion of the DMI – Directional Movement Index improves the indicator’s value. Multiple-time frames can help forex traders trade the histogram DMI with the oscillator ADX indicator’s selling and buying trading signals more effectively.

He is an expert in financial niche, long-term trading, and weekly technical levels.
The primary field of Igor's research is the application of machine learning in algorithmic trading.
Education: Computer Engineering and Ph.D. in machine learning.
Igor regularly publishes trading-related videos on the Fxigor Youtube channel.
To contact Igor write on:
igor@forex.in.rs
Related posts:
- Download MACD 4C Indicator
- Free Download Power Trend Indicator MT4
- Download Free Hawkeye Volume MT4 Indicator! – How to read Hawkeye volume indicator?
- Traders Dynamic Index Indicator – Download TDI Indicator
- Choppiness Index Indicator For MT4 Download Free!
- FX Vortex Indicator Free Download
- Free Download True Strength Index TSI Indicator
- Download Currency Pair Correlation Indicator!
- Download MACD 2 Line Indicator for MT4!
- Download Half Trend Indicator MT4
- What is the Best Momentum Indicator?
- RSI Filter Indicator – Free Download
