Developed by Welles Wilder, the Direction Movement System is a technical indicator that is rather complex to understand. You can read more about it in the author’s book. Despite being a difficult indicator to understand, it is deemed superior to the rest as it can overcome the one basic problem that is persistent with other indicators. Most indicators can work well in either a trending market or a ranging market. Such is not the case with the Direction Movement System. This indicator can identify the type of market and then provides signals that traders can use for trading.
What is Direction Movement System?
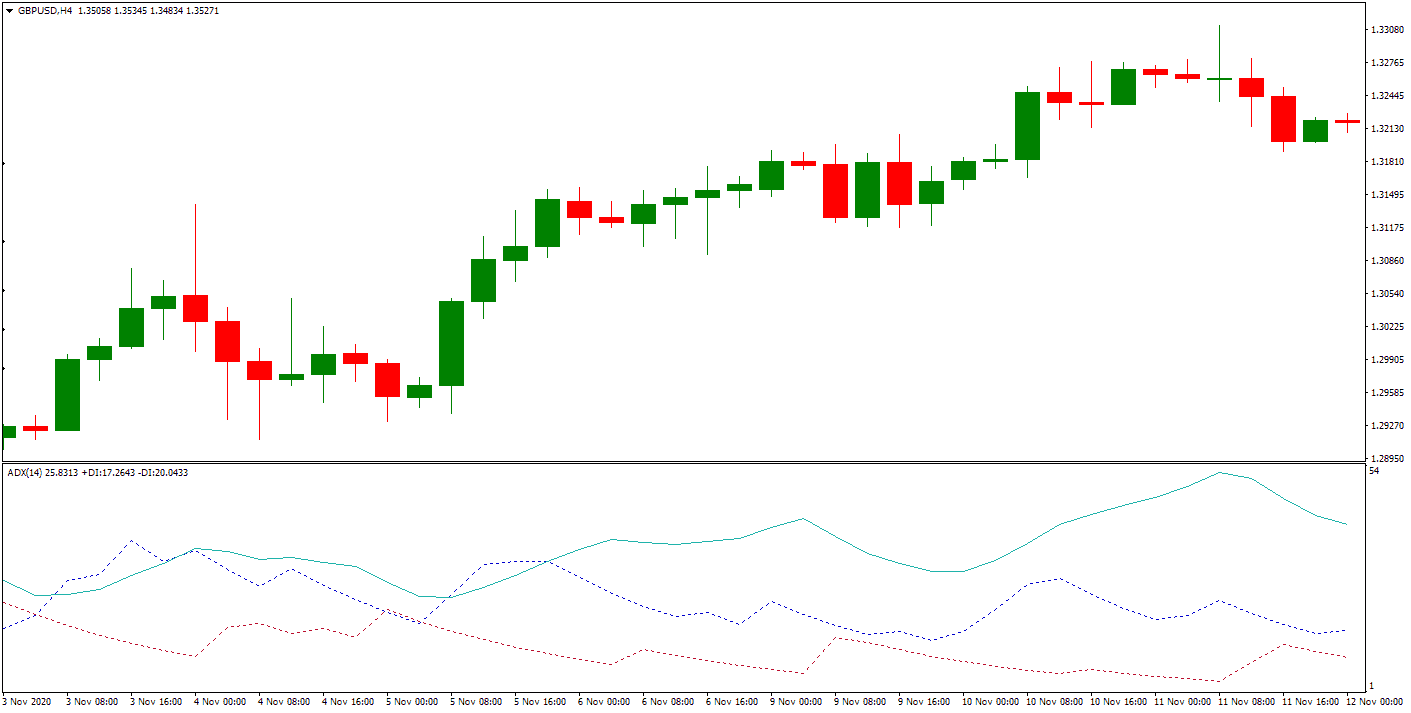
Direction Movement System represents an indicator that measures price move outside the N period of the trading range. Direction Movement System consists of three lines: The Average Directional Movement Index (ADX) that indicates whether the market is trending or ranging; the Positive Direction Indicator (+DI) measures upward trend movement; The Negative Direction Indicator (-DI) measures downward trend movement.


This system has three lines that collectively consider the ability of bears and bulls in moving prices beyond the last trading day’s trading range. Let’s read about these three lines:
- The first one is the Positive Direction Indicator, denoted as (+DI). It gives details about the movement related to an upward trend.
- The second one is the Negative Direction Indicator, denoted as (-DI). It gives details about the movement related to downward trends.
- The third one is the Average Direction Movement Index, denoted as (ADX). It helps you to assess whether the market is ranging or trending.
Directional Movement System and Trading Signals
This system has made way for the development of various trading systems. Dr. Alexander Elder presented many such systems in his book ‘Trading for a Living.’ Some of these systems are explained below:

Case 1: Go long when:
- The Positive Directional Indicator is above the Negative Directional indicator.
- The Average Direction Movement Index rises while (+DI) and ADX lay above (-DI).
- The Average Direction Movement Index rises from below the other two lines.
- Exit this position; the Positive Directional Indicator crosses below the Negative Directional indicator.
Case 2: Go Short when:
- The Negative Directional Indicator is above the Positive Directional indicator.
- The Average Direction Movement Index rises while (-DI) and ADX lay above (+DI).
- The Average Direction Movement Index rises from below the other two lines.
- Exit this position; the Negative Directional Indicator crosses below the Positive Directional indicator.
The Average Directional Movement System (ADX)
The declining ADX is indicative of a market that is losing its direction. When the ADX line falls below the other two lines, it shows that the market has become lifeless. Trading using the Directional Movement System should be avoided till the ADX has turned off bottom clearly. According to DR. Elder, traders should wait until the ADX line rises at least 4 steps off the low. For example, ADX rises to 20 from a low of 16. The longer the ADX remains below the other two lines, the stronger the trend will be.
When the ADX moves above -DI and +Di, it shows that market has become overheated. It would help if you took a profit in this case when the ADX starts turning downward again.
How to Set-Up the Directional Movement System
Welles Wilder’s Directional Movement System is not based on your standard moving averages (MA) formula. This indicator’s default setting also uses a 14-day smoothing, but it is very different from the 14-day Exponential Moving Averages. The standard EMA converts the time period into a fraction. A formula is used for this conversion; however, the Directional Movement System does not use that same formula. We have explained the formula below.
You can go to the indicator panel available on your dashboard and change the default settings.
The Formula for Directional Movement System
Welles Wilder created several indicators, including the RSI and the ATR. While other indicators have similar formulae, the Directional Movement System is different and runs on a different formula. This is how it is calculated:
- First and foremost, you are required to calculate the present day’s Directional movement. If the DM (Directional Movement) is positive, that is, today’s high is more than yesterday’s high, we will say the price is moving upward. If the DM is negative, that is, today’s high is less than yesterday’s high, we will say the price is moving downwards. A positive and negative DM cannot occur together on the same day.
- The next step is to calculate the true range.
- Now, you need to calculate the indicators. You need to divide the directional indicators’ positive and negative values by the True Range for your chosen time period.
- Finally, calculate the individual components of the ADX. Start by calculating the Directional Indicator difference. Let’s assume that your chosen time period is 14 days, then take the difference between the positive and the negative DIs of that period. Count it as a positive number. Now, divide this number with the sum of the above two DIs to obtain the Directional Index.
Things to Keep in Mind
The Directional Movement System does not use the standard formula for calculating exponential moving averages. Therefore, you need to be cautious while setting your time period. Start with using shorter time periods.

He is an expert in financial niche, long-term trading, and weekly technical levels.
The primary field of Igor's research is the application of machine learning in algorithmic trading.
Education: Computer Engineering and Ph.D. in machine learning.
Igor regularly publishes trading-related videos on the Fxigor Youtube channel.
To contact Igor write on:
igor@forex.in.rs
