As we know, divergence represents a chart pattern when an asset’s price moves in the opposite direction of an oscillator.
Most traders use indicators to learn more about divergences, as they tell you about possible trends, strengths, and reversals. Most indicators highlight divergences with the help of peaks and troughs. These are created on the price charts along with a series of similar highs and lows. You can expect a possible reversal when the indicator cannot imitate the price chart pattern. It also indicates that the trend might be weak.
If there is an uptrend, and the price reaches a new high, the indicator cannot do so; the divergence is bearish. Conversely, the divergence is bullish if there is a downtrend and the price reaches a new low, but the indicator cannot do so.


However, there is one more – triple divergence except for bullish and bearish divergence.


What is a triple divergence?
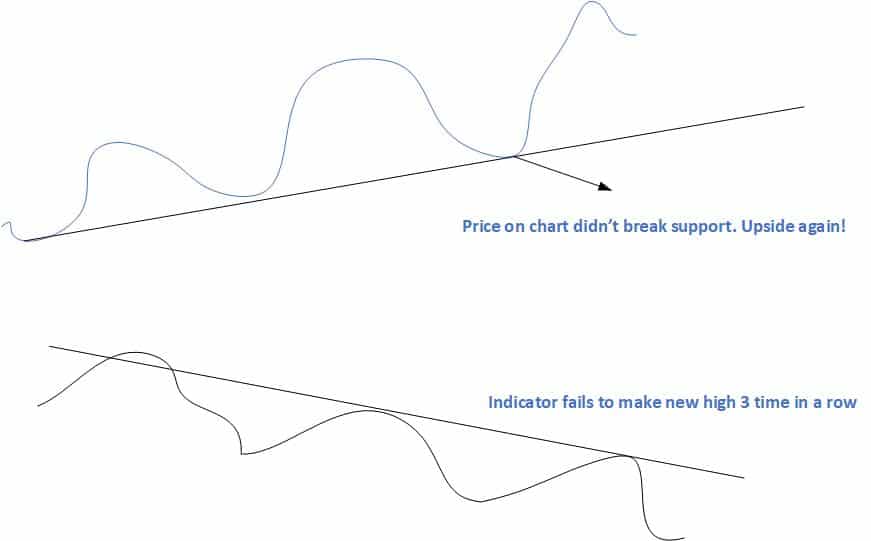
Triple divergence represents a false divergence signal when the price makes a new and higher high (during an uptrend) or a lower low (during a downtrend ). Still, the direction does not reverse after three attempts.
For example, a triple bearish divergence has three times in a row false bearish reversal:

Triple divergence should not be considered when the trend is weak and when:
- When the price and indicator, respectively, make an equal High and a lower High.
- When the price and the indicator are equal, it is low and a higher low.
- When both the price and the indicator make an equal High
- When both the price and the indicator make an equal Low
- The difference in the height of peaks and troughs is almost negligible.
Summary:
Triple divergence in trading is a concept used in technical analysis, specifically when analyzing momentum indicators. Here’s a breakdown of what it means:
- Definition: Triple divergence refers to a scenario where a financial instrument’s price and a momentum indicator (like the Relative Strength Index (RSI), Moving Average Convergence Divergence (MACD), or Stochastic Oscillator) diverge from each other three times consecutively, suggesting a potential reversal in the current trend.
- Types:
- Bullish Triple Divergence: Occurs when the price of an asset makes three successive lows, but the momentum indicator makes three consecutive higher lows. This suggests a weakening downward momentum and a potential upward trend reversal.
- Bearish Triple Divergence: Occurs when the price of an asset makes three successive highs, but the momentum indicator makes three consecutive lower highs. This indicates weakening upward momentum and a potential downward trend reversal.
- Significance:
- Strengthens Signal: Triple divergence is considered a stronger signal than single or double divergence because it indicates persistent divergence over a more extended period, suggesting a more significant potential for trend reversal.
- Increased Reliability: The repetition of divergence enhances its reliability as a trading signal, making traders more confident in considering potential entries or exits based on this pattern.
- Usage in Trading:
- Entry or Exit Signals: Traders might use triple divergence to anticipate a trend reversal and enter a new position or exit an existing one.
- Risk Management: It manages risk by signaling when a trend might be losing momentum, prompting traders to tighten stop-loss orders or take profits.
Conclusion
All these trading signals are essential and work differently when creating trading strategies. Different traders use different indicators. Remember that using a single indicator can cause more harm than good. It is better to use at least three complementary indicators at once.
Triple divergence, while a complex concept, is an important phenomenon to understand for traders keen on leveraging technical analysis in their trading strategies. As a false divergence signal, it can potentially mislead traders into making incorrect trading decisions. However, with a thorough understanding of the concept, traders can better anticipate these scenarios and adjust their strategies accordingly. Moreover, the beingness of the pitfalls and opportunities associated with triple divergence can help traders stay on the right track, regardless of market conditions.

He is an expert in financial niche, long-term trading, and weekly technical levels.
The primary field of Igor's research is the application of machine learning in algorithmic trading.
Education: Computer Engineering and Ph.D. in machine learning.
Igor regularly publishes trading-related videos on the Fxigor Youtube channel.
To contact Igor write on:
igor@forex.in.rs
