Table of Contents
Trading in a stock market can be easy if the trader knows different indicators and technical analyses. These indicators and technical analyses can help traders gain the desired outcome.
One such popular technical analysis is divergence. A trader who has been trading for quite some time now will be well aware of how this technical analysis, combined with an efficient indicator, can be instrumental in predicting the market.


What is a divergence in forex trading?
Divergence is the price movement process when an asset’s price (currency pair) moves in the opposite direction of a technical indicator, usually an oscillator. Divergence warns that the current price trend may lead to a price-changing direction.


Divergence indicates whether the ongoing trend will continue or reverse in the trend. This interpretation becomes more convenient when a trader has subsequent knowledge of what type of divergence means in which situation.
Divergence Cheat Sheet
In this Divergence Cheat Sheet, you will get a video, a free mt4 divergence indicator, and knowledge on how to use divergence situations when the asset price goes in one direction and the oscillator goes in another.
To download the free divergence indicator, please visit our download section.
Traditionally, there are two types of divergence: Regular Divergence and Hidden Divergence. The divergence shows different predictions, and understanding them ultimately can work as a divergence cheat sheet for the trader.

Divergence Bias
Before getting into the cheat sheet, it is essential to understand the word bias in divergence. Any prediction that may arise due to the above divergences will have a bearish or bullish bias. Bias means the strong signal that the divergence is creating. It becomes more evident when one learns about the two types of divergences.
Let’s read the cheat sheet to help traders understand the hidden and regular divergence more clearly.
Cheat Sheet for Regular Divergence
A regular divergence signals an expected reversal in the current trend. The standard divergence bias shows how the possible reversal may take place.
Following are the two types of common divergence bias and what they indicate.
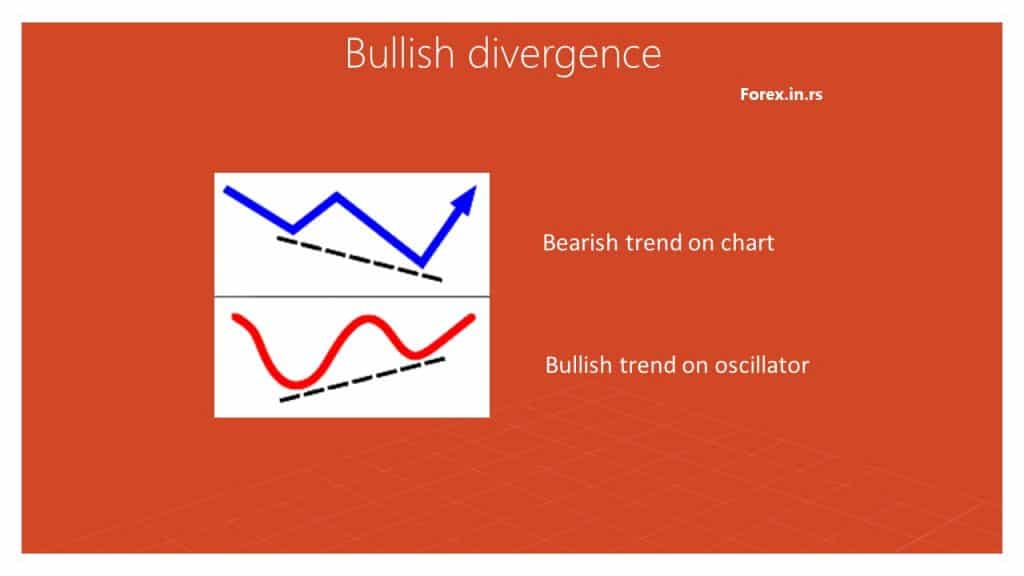
- Regular Bullish Divergence: In this case, the market shows the security price at a lower low, but the indicator or oscillator shows a higher low. This situation indicates that the bearish trend is losing its strength, and a possible bullish trend is taking a powerful position. Hence, the possibility of a trend reversal from bearish to bullish.
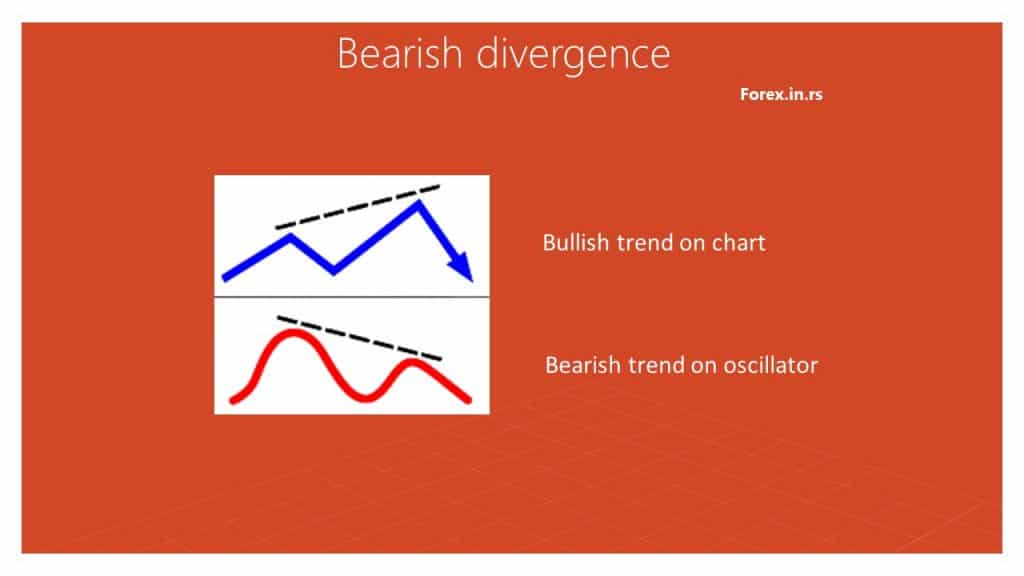
- Regular Bearish Divergence: Another case is when the market shows the price at a higher high, but the oscillator or indicator shows a lower high. This situation is bearish bias as it indicates that the bullish trend is no longer decisive, and the bearish trend may take over. Therefore, a possible problem of a trend reversal from bullish to bearish.
Cheat Sheet for Hidden Divergence
Unlike the Regular Divergence, the Hidden Divergence indicates that the current trend may continue. The bias of hidden divergence means in which direction the trend is likely to continue.
Following are the two types of hidden divergence bias and what they indicate.
- Hidden Bearish Divergence: when the price shows a lower high, but the indicator reflects a higher high, the trader can expect the situation to be bear bias. , the bearish or downward trend is expected to continue. In such cases, the traders take selling positions.
- Hidden Bullish Divergence: when the market price of the security is at a higher low, but the oscillator reflects a lower low; the trend is bull bias. In this case, the trader can expect a bullish or upward trend. Thus, this is expected to be a perfect time for traders to enter or re-enter the market.
See hidden bearish divergence:
Understanding divergences is not very complicated. A thorough read and a little practice can make traders use divergence to make predictions in the market. But, it is essential to know that a technical indicator is necessary for making these predictions. Without an indicator, the trader can not ascertain the movement of the trend. This becomes even more crucial when using a momentum oscillator like RSI (Relative Strength Index), CCI (Commodity Channel Index), or Williams %R.
Conclusion
Please read the two types of divergences and their biases to predict the security or commodity market. Then, the cheat sheet can help the trader ascertain their entry or exit from the market and make decisions according to the predictions.

He is an expert in financial niche, long-term trading, and weekly technical levels.
The primary field of Igor's research is the application of machine learning in algorithmic trading.
Education: Computer Engineering and Ph.D. in machine learning.
Igor regularly publishes trading-related videos on the Fxigor Youtube channel.
To contact Igor write on:
igor@forex.in.rs
Related posts:
- What is Triple Divergence?
- Download RSI Divergence Indicator for MT4
- Download MACD Divergence Indicator MT4!
- The Best Divergence Trading Strategy
- Bullish Divergence and Bearish Divergence in Detail
- What is a Deal Sheet?
- Download QQE Indicator! How to use QQE Indicator?
- What is the Best Momentum Indicator?
- How to Read VWAP?
- Download SSL Channel Indicator For MT4!
- Download Elliott Wave Indicator
- Free Download True Strength Index TSI Indicator
