Table of Contents
In trading, charts and oscillator indicators don’t always move in tandem. While price charts depict the actual movement of an asset, oscillators like RSI or MACD measure momentum or other underlying factors. This discrepancy can lead to “divergences,” where the direction of the price and the oscillator diverge, offering potential insights into future market moves.
A bullish and bearish divergence occurs when price trends differ from technical indicators, such as moving averages or oscillators. When this happens, the trader can exploit the diverging signals to capitalize on potential profits.


What is a bullish divergence in trading?
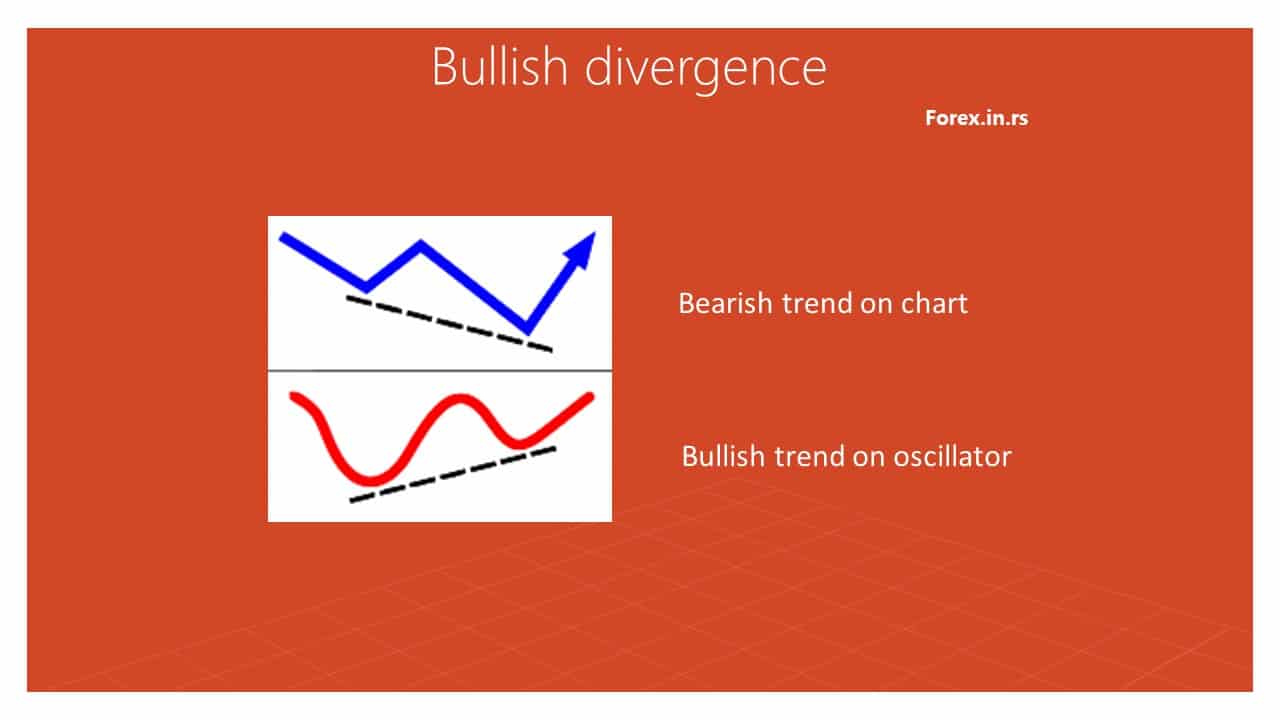
Bullish Divergence in trading represents when an asset’s price on the chart moves downside in the opposite direction of an upside technical oscillator. For example, during bullish divergence, the price goes bearish on the chart, and at the same time, MACD, RSI Stochastic, or any other oscillator shows a bullish (uptrend) trend.


Please download the free divergence indicator for MT4.
Bullish divergence example:

Bullish divergence characteristic
- Definition: Bullish divergence occurs when the price of an asset is making lower lows while a technical oscillator is making higher lows.
- Indication: This pattern indicates underlying strength or momentum shifting to the upside even if prices are currently falling. The divergence hints that the downward price trend is losing steam and might reverse soon.
- Oscillators Involved: Bullish divergence can be identified using various oscillators. Common ones include:
- Relative Strength Index (RSI)
- Moving Average Convergence Divergence (MACD)
- Stochastic Oscillator
- And others.
- Confirmation: Many traders look for confirmation signals to consider a bullish divergence valid. This can be in the form of:
- A reversal candlestick pattern.
- The oscillator crosses a certain threshold or level.
- A breakout through a resistance level on the price chart.
- Limitations:
- Bullish divergences don’t always result in a price reversal. They indicate potential reversals, but other factors and market conditions should also be considered.
- The timing of the reversal can be uncertain. Even if a reversal occurs, it might not happen immediately after the divergence is spotted.
- Usage:
- Bullish divergences can be used for potential entry points for long positions.
- They can also be utilized to exit short positions, anticipating a possible price increase.
- Confluence with Other Indicators: It’s often advised to use bullish divergence with other technical indicators or chart patterns for better accuracy and to reduce false signals.
- Timeframes: Divergences can be identified on various timeframes. However, divergences on longer timeframes (like daily or weekly) are often considered more significant than those on shorter timeframes (like hourly).
- Volume: While volume is not a direct characteristic of divergence, it can be a useful confirming tool. An increase in volume during or after the formation of a bullish divergence can lend more credence to the possibility of a price reversal.
What is bearish divergence?
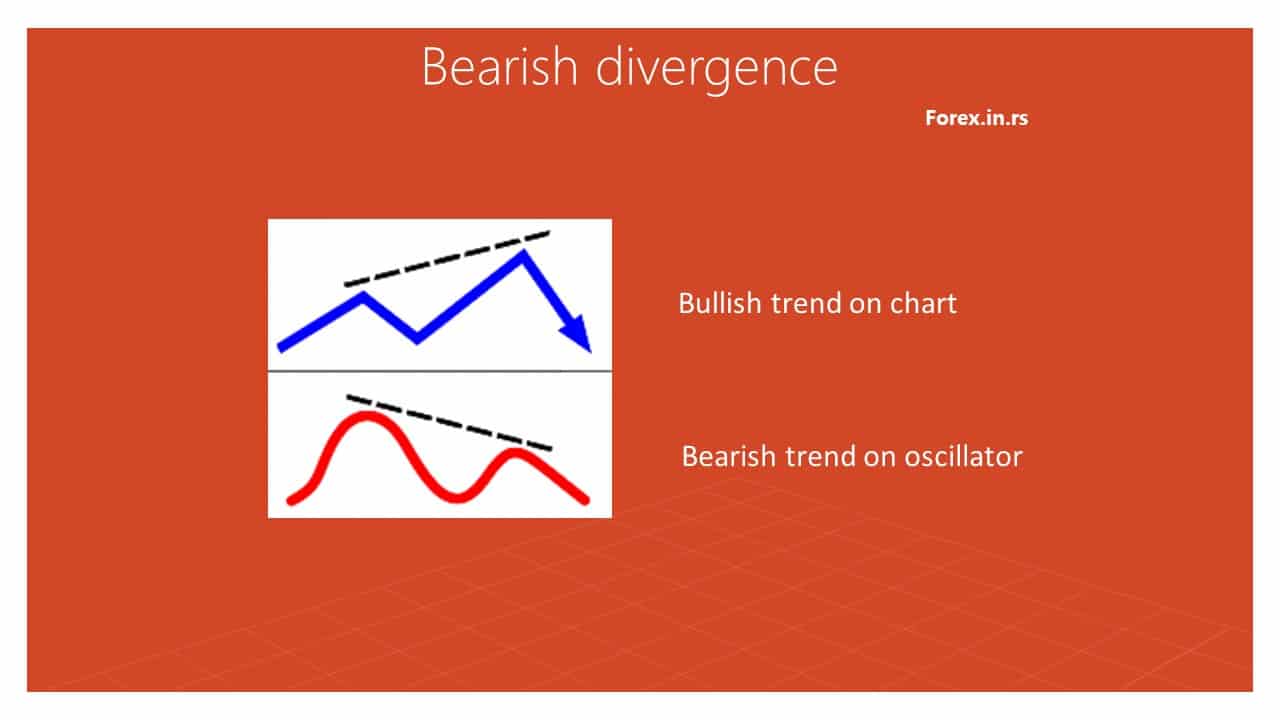
Bearish Divergence in trading represents when an asset’s price on the chart moves upside, in the opposite direction of a downside technical oscillator. For example, during bearish divergence, the price goes bullish on the chart, and at the same time, MACD, RSI Stochastic, or any other oscillator shows a bearish (down) trend.
Bearish divergence example:
Bearish divergence characteristics
- Definition: Bearish divergence occurs when the price of an asset makes higher highs while a technical oscillator is making lower highs.
- Indication: This pattern signals that the current upward price movement might be losing momentum, and a potential downward trend could be on the horizon.
- Oscillators Involved: Bearish divergence can be spotted using various oscillators, including:
- Relative Strength Index (RSI)
- Moving Average Convergence Divergence (MACD)
- Stochastic Oscillator
- And others.
- Confirmation: Traders often seek confirmation signals to validate a bearish divergence, such as:
- A reversal candlestick pattern.
- The oscillator crosses below a certain threshold.
- A breakdown below a support level on the price chart.
- Limitations:
- Bearish divergences don’t always lead to a downward price movement; they signal potential reversals, so other market aspects should be considered.
- The exact timing of a reversal remains uncertain, meaning it might not happen right after the divergence is identified.
- Usage:
- Bearish divergences can guide traders in establishing short positions or exiting long positions in anticipation of a potential price decline.
- Confluence with Other Indicators: For higher accuracy and reduced false signals, it’s advisable to use bearish divergence in conjunction with other technical indicators or chart patterns.
- Timeframes: Divergences can be observed across various timeframes. Divergences on longer timeframes (e.g., daily or weekly charts) are typically viewed as more impactful than those on shorter timeframes.
- Volume: While not a direct characteristic, volume can be a confirming tool. A decline in volume during or after a bearish divergence may reinforce the potential for a price drop.
Divergences precede the price action. It results from a strong disagreement between the price action and the technical indicator that the trader is using. As the opposite of the bearish divergence, a bullish divergence occurs when the prices reach the lower lows, but the indicator shows a higher low. This indicates that an upward trend is likely.
How do we detect divergence on the chart?
- If the price makes higher lows, but the RSI shows lower lows, – it is a bullish signal.
- If the price makes higher highs while the RSI lowers, it is a negative or bearish signal.
Investors can also combine divergences in longer-term trading strategies with trend lines or chart patterns such as triangles or flags/pennants. This can help identify areas of possible reversals, which could give investors opportunities to buy before significant moves up or down in price occur. Moreover, understanding how each type of indicator works together with other indicators can help traders position themselves accordingly when markets turn volatile since they will have more information at their disposal when making decisions about entry and exit points for positions as well as stop loss levels for minimizing losses should things not turn out as expected.
If used correctly and combined with other methods such as chart analysis and fundamental analysis, bullish and bearish divergences can provide good opportunities for traders looking to take advantage of short-term price changes or longer-term reversals depending on their needs and preferences. With enough practice over time, any trader should become proficient at spotting these divergences quickly enough so they don’t miss out on any potential profits that may come their way when markets turn choppy or start trending again after periods of consolidation.
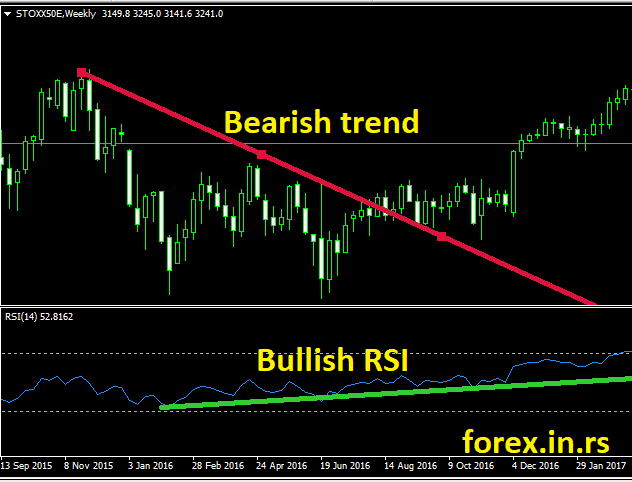
What is bullish RSI divergence?
Bullish RSI divergence represents an example when the chart’s price makes lower lows and the price on the RSI indicator higher highs. Bullish RSI divergence usually predicts a future possible bullish trend. In the image below, we can see a bullish RSI divergence.
To understand the investor’s approach to the market, indicators are the most accurate representation. They help analyze if the market is “oversold” or overextended to the downside.
In general, bullish divergence indicates a potential for an upward move in the asset’s price trend, while bearish divergence could signal a downturn in the underlying asset. A bullish divergence occurs when prices are falling while technical indicators are rising. For example, suppose yesterday’s low was lower than Today’s, but a Relative Strength Index (RSI) oscillator crossed above its average line or resistance level. In that case, there may be a bullish signal forming. This signal would indicate that even though the prices are decreasing, there could be strength in the asset, which may lead to an eventual uptrend. On the other hand, bearish divergence takes place when prices are rising while technical indicators are falling.
For instance, if yesterday’s high was higher than Today’s and an RSI oscillator dropped below its average line or support level, then there could be a bearish signal taking shape. This signifies that selling pressure is building despite increasing prices, which could lead to an eventual downtrend. However, as with most trading strategies, investors must use other technical and fundamental factors to confirm bullish or bearish divergences before entering positions to reduce risk exposure and increase profitability potential.
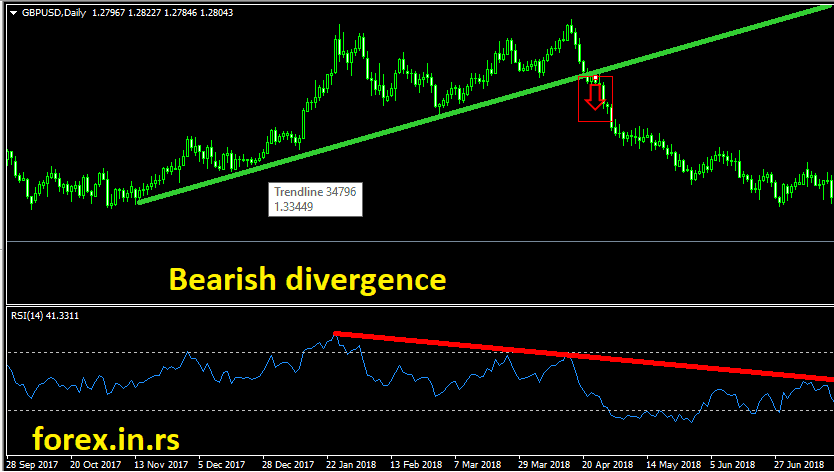
What is RSI bearish divergence?
Bearish RSI divergence represents an example when the chart’s price makes higher highs, and the price on the RSI indicator lowers lows. Bearish RSI divergence usually predicts a future possible bearish trend.
In the image below, we can see a bearish RSI divergence.
As discussed before, a bearish divergence occurs when the price reaches a higher high, but the indicators show a lower high. This means that a downward trend is likely. This situation indicates the market is coming out of the bullish divergence (upward trend), and it is overextending or “overbuying” to the upside.
Divergences are of different strengths. Whether bearish or bullish, their strength foretells the traders about the possible market situation. Class A divergence, being the strongest, indicates the best time to trade. On the other hand, Class B (of lesser strength) and Class C (the weakest) divergences are not favorable. Traders avoid them as they are full of uncertainties.
Class A bearish divergence is when prices touch a new high while the oscillator fails to keep up. It can only reach a price lower than the price in the previous rally. It also signifies a sudden return toward a downtrend. When the prices decline to a new low, and the oscillator fails to reach the low point shown in the previous decline, it is a Class A bullish divergence. It is the best indicator that a sharp rally is approaching.
Class B bearish divergence occurs when the prices make a double top while the oscillator traces a lower second top. Thus, it can be said that the prices trace a double bottom, and the oscillator traces a higher second bottom when there is a Class B bullish divergence.
Class C bearish divergence is when prices move upwards and create a new high, and the indicator doesn’t follow that lead. It remains at the same level as the last rally. Class C bullish divergence is when prices drop to a new low, and the indicator shows the price at a double bottom. Class C divergences indicate stagnation in the market. This means neither the bulls nor the bears are becoming stronger or weaker.
Divergence Oscillator
Divergence oscillators are indicators that the current price trend may be changing. They mark the high and the low bands between two extreme values in the market, and then the trend indicators fluctuate between these bands. A bullish divergence occurs if the oscillator falls short of reaching the new low created by the fall of the prices. When the bulls rule, the end of the downtrend begins. During bullish divergence, the bull gains control of the market again while the bear loses power.
Bearish divergence hints towards a potential downtrend as the prices reach a new high. It stands in contrast to the bullish market. Here, the oscillator fails to touch the recent high. As the prices rise due to inertia, the bear prepares to take charge.
How Rate of Change and Momentum Affect the Market
Divergences help traders to identify the valid point when the market’s momentum may change. Along with recognizing an upcoming change, the traders can also discover the speed and the direction of the approaching momentum. These changes can be high speed, low speed, or may remain stagnant in progress. The best tool to find out this speed is the Rate of Change. The trader can compare the present-day closing price to the closing price Y days ago using the Rate of Change.
RoC= Today’s closing price / Closing price days ago
The RoC was Today’s closing price ratio to the closing price Y days ago. If Today’s price exceeds the previous price, RoC is greater than 1. If Today’s price exceeds the last closing price, the RoC is smaller than 1. RoC is one if both prices are equal. When these RoC values are plotted as a linear diagram, they demonstrate whether the RoC is rising or falling.
Another way to discover the speed of the market’s change is to calculate its momentum. It is similar to the Rate Of change, but instead of giving a ratio, it gives you a number. A trader will subtract the previous day’s closing price from the current closing price to calculate the same momentum.
Momentum (M)= Today’s closing price – Closing price Y days ago
These momentum prices are calculated every day. They give the traders points to create a linear presentation. This linear presentation helps to understand the momentum trend, rising or falling. Momentum can be positive or negative, depending upon which price is higher. If the previous price is higher, it is negative; if Today’s price is higher, it is positive. It can be zero if both prices are the same.
Use of Momentum for the Traders
The trader’s first step is selecting a time window while calculating the RoC or the momentum. This time window is generally advised to be narrow for oscillators. While trend-following indicators work best for the long-term trend, oscillators are best for detecting short-term market changes, like assessing a week’s momentum.
When the RoC or the momentum reaches a new high, the market becomes positive, and the prices probably go higher. When these two fall to a new low, the situation indicates that there might be a decline in the market, and the prices may also fall.
Traders may expect a top approach when the RoC or the momentum falls, but the prices rise. This indicates a good time for those in an extended position who want to lock in their profits or tighten their protective stops. A bearish divergence occurs when prices reach a new high with Roc or momentum going to a lower top. This indicates that the time is good to sell. At the same time, the bullish divergence suggests that the time is good to start buying.
A market is very uncertain, and solid indicators can challenge traders’ expectations at every step. But, these differences between expectations and reality make a trader strong in his skills.
Trading divergences
As discussed, a bearish signal is when the price reaches higher highs, but the oscillator (here, RSI) demonstrates a lower high. This indicates that the prices are likely to show a downward trend.
This signal is also considered the session of diverging trends between the indicator and prices when the indicators peak in the “overbought” territory.
When the indicators do not agree with the current price, i.e., when the divergences form and begin to drop, the technical traders have two choices. First, long traders have the opportunity to go safe and be calculative about risk control. They can do so by putting a stop price (tight stop), reviewing the security portfolios, or taking protective options.
Additionally, a bearish divergence provides excellent opportunities for speculative trades for the short market and buy put options. It is up to the trader which course of action they would take. The signal has given them actionable information.
In simple words, applying divergence to different indicators is fundamental and straightforward. With just basic knowledge, one can understand how divergences work.
Being uncommon, divergences are easily identified by anyone involved in trading or who has a basic knowledge of it. They are critical indicators of the change in the direction of the stock trend or market situations. While the trendsetters will take measures to control risk, speculative traders will look for a potential reversal trade opportunity. Through this article, one can understand the basics of trading divergences and learn how to study the line market for divergences using technical indicators beyond the RSI (Relative Strength Index)
What are the alternatives to using the RSI?
RSI is only one of the few indicators that help to understand the market situation. RSI uses the standardized extreme range approach to ascertain the divergences, which is not in the case of other technical indicators. With extreme ranges, it becomes convenient to understand these signals. But that doesn’t mean the trader cannot expect the same convenience as other indicators.
RSI oscillates within a fixed range of 1-100 (including the extremes). Simultaneously, some preferred oscillators, such as MACD, CCI, or stochastic, do not work in a constrained range. In this situation, looking at recent history and discovering the divergences when these oscillators reflect highs and lows beyond their normal range is advised.
The chart below shows RSI sets higher lows(1) in the lower extreme while the market shows lower lows. This is the case of a bullish divergence. The same signal can be seen on CCI. It is hitting more extreme lows (2) compared to recent history. Similarly, it is also evident in the MACD (3). This is because it extends below its current range.
All the indicators will show similar results when applied to the same situation. This is because the information used in all the oscillators is reasonably identical, and the ways to calculate these signals are also very similar. It all depends on the trader’s preference and which indicator he is more convenient with. They may stick to RSI or choose another oscillator like MACD or CCI.
You can learn to find this pattern using previous data. Try to notice their appearance in the market’s current trend. It would help if you thought from a long-term trader perspective to give your trading game plan a finishing touch.
Divergent oscillators provide traders with the most vital indicators of the market’s future and speed. When Roc and momentum are combined with these evident divergences, the traders can calculate the most likely moment when the market will shift the direction.
Conclusion
In trading, bullish and bearish divergences are potential indicators of upcoming reversals in price trends. A bullish divergence emerges when the asset’s price registers lower lows while a technical oscillator marks higher highs, hinting at an upward shift in momentum. Conversely, bearish divergence arises when the price makes higher highs, but the oscillator shows lower highs, suggesting a possible downward turn. Traders often use these patterns with other technical tools for enhanced accuracy. However, as with all indicators, they should be cautiously approached since they don’t guarantee a trend reversal.

He is an expert in financial niche, long-term trading, and weekly technical levels.
The primary field of Igor's research is the application of machine learning in algorithmic trading.
Education: Computer Engineering and Ph.D. in machine learning.
Igor regularly publishes trading-related videos on the Fxigor Youtube channel.
To contact Igor write on:
igor@forex.in.rs
